
Performance comparison of different asset classes
This article examines the performance of different asset classes over the past 10 years: equities, government bonds, corporate bonds, gold
Wednesday, 16 March 2022

How much would I have made in 10 years investing € 10000 on an equally-weighted portfolio consisting of the major asset classes?
Let’s see with this analysis carried out on the following instruments:
- Equity: 25%
- Government bond: 25%
- Corporate bond: 25%.
- Gold: 25%
Investment simulation over the last 10 years –> PIC Simulator
From the following table we can see that the maximum drawdown of the portfolio corresponds to the Covid-19 period, with the minimum of -17.84% reached on 18-03-2020. The final value after 10 years has almost doubled, with a performance of around 90%.
| Total Amount Invested | Final Portfolio Value | Profit | Volatility | Annualised Return | Maximum Drawdown |
|---|---|---|---|---|---|
| 10000€ | 18885.54€ | 88.86% | 7.1% | 6.2% | -17.84% in data 2020-03-18 |
Percentage performance comparison –> Comparator
The comparison analysis shows how predictably over a 10-year period the equity component outperforms the other asset classes with the obvious disadvantage of higher volatility and higher drawdowns.
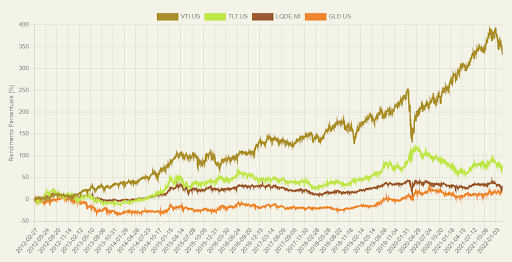
| Asset | Performance (10 years) |
|---|---|
| US Equity ETF | 331.27% |
| US 20-Year Government Bond ETF | 76.16% |
| US Corporate Bond ETF | 28.82%. |
| Gold ETF | 19.3% |
Related guides
The 60/40 portfolio: historical analysis of a 500 euro/month PAC
Historical analysis of a 60/40 stock-bond portfolio: origins, results of a 500 euro/month PAC with annual rebalancing, …
Free ETF Portfolio Simulator: practical guide
How to use a free ETF portfolio simulator to test a strategy, compare benchmarks, and move to execution with Wallible.
Average S&P 500 return over the last 20 years: how to read it with a PAC simulation
How to interpret the average S&P 500 return over the last 20 years, avoid common pitfalls, and use a PAC simulation for …
