
Comparison of the 5 most capitalised companies in the FTSE MIB
In this article we examine the performance, correlation and other statistics of the top 5 capitalised companies in the FTSE MIB
Saturday, 26 March 2022

How have the 5 most capitalised companies in the FTSE MIB performed over the last 10 years?
Let’s see by trying to simulate a PAC with 10000€ initial investment and 300€ recurring each month on the following companies:
- Enel: 20%
- Stellantis: 20%
- ENI: 20%
- Intesa Sanpaolo: 20%
- Ferrari: 20%
Recurring investment simulation over the last 10 years –> PAC simulator
From the following graphs, we can immediately see that the value of the portfolio has more than doubled compared to the investment, with a final present value of the simulation of around €120000. The high volatility and maximum drawdown during the Covid19 period highlight the criticality of an entirely equity portfolio that is geographically and sectorally not well diversified.
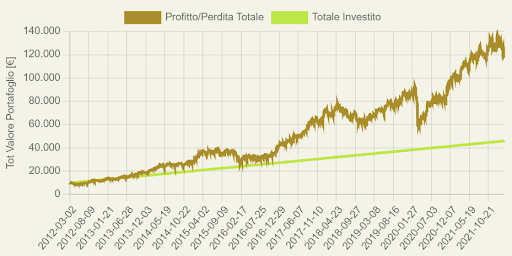
| Total Amount Invested | Final Portfolio Value | Profit | Volatility | Annualised Return | Maximum Drawdown |
|---|---|---|---|---|---|
| 46000€ | 119101.36€ | 158.92% | 24.1% | 18.8% | -37.43% in data 2020-03-12 |
But who performed better among the 5? –> Comparator
From the performance, we see that Ferrari has achieved around 350% in just 6 years since it was listed, and the other performances in the table follow.
| Asset performance (10 years) | |
|---|---|
| Ferrari | 353.57% |
| Stellantis | 202.34% |
| Enel | 118.53% |
| ENI | 47% |
| Intesa Sanpaolo | 23.46% |
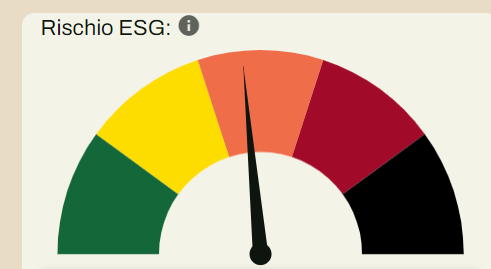
And how is such a portfolio positioned in terms of ESG?
The speedometer shows an intermediate ESG risk for this portfolio… without infamy or praise!
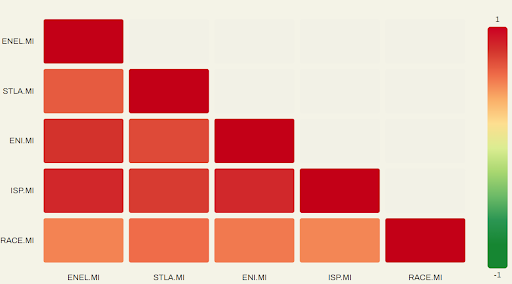
Securities correlation matrix –> Correlator
As was to be expected, the securities are all positively correlated. The correlation matrix shows the pair with maximum and minimum correlation: Max → ENEL - Intesa Sanpaolo: 0.65 Min → Intesa Sanpaolo - Ferrari: 0.32
Conclusions
The analysis was carried out on a portfolio in which the underlyings are weighted equally at 20% and are part of the same equity index. Although there is partial diversification at sector level, it can be seen that such a portfolio, entirely in equities, presents a very high level of risk against a return over 10 years that in this case rewarded the risk taken. The ESG profile of such a portfolio is at an intermediate level and the correlation of securities is rather high.
Related guides
The 60/40 portfolio: historical analysis of a 500 euro/month PAC
Historical analysis of a 60/40 stock-bond portfolio: origins, results of a 500 euro/month PAC with annual rebalancing, …
Free ETF Portfolio Simulator: practical guide
How to use a free ETF portfolio simulator to test a strategy, compare benchmarks, and move to execution with Wallible.
Average S&P 500 return over the last 20 years: how to read it with a PAC simulation
How to interpret the average S&P 500 return over the last 20 years, avoid common pitfalls, and use a PAC simulation for …
