
Comparison of the 5 most capitalized companies by sector in the S&P500
In this article we go over the performance, performance of a $1,000 investment, correlation and other statistics of the top 5 capitalized companies by sector in the S&P500 over the past 10 years: technology, healthcare, energy, consumer goods and finance
Wednesday, 30 March 2022

10000€ investment simulation over the last 10 years –> PIC simulator.
From the following graph and table we note that the maximum drawdown of the portfolio corresponds to the Covid-19 period, with the minimum of -32.96% touched on 23-03-2020. The final value after 10 years has more than quadrupled, with a performance of about 330%.
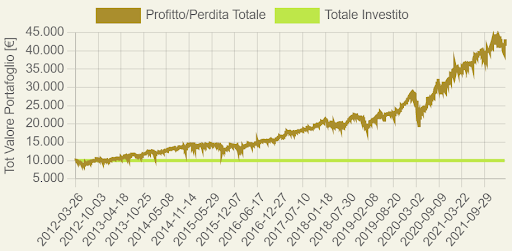
| Total Amount Invested | Final Portfolio Value | Profit | Volatility | Annualized Return | Maximum Drawdown |
|---|---|---|---|---|---|
| 10000€ | 43177.71€ | 331.78% | 17% | 17.6% | -32.96% on 2020-03-23 |
But who performed better among the 5? –> Comparator
Comparison analysis shows that over a 10-year period, Apple has clearly outperformed the other stocks by actually increasing its value tenfold, however, against more pronounced volatility. Volatility not to be underestimated for JPMorgan as well. Johnson & Johnson and Procter & Gamble had more linear growth while ExxonMobil “suffered” more than the other stocks.
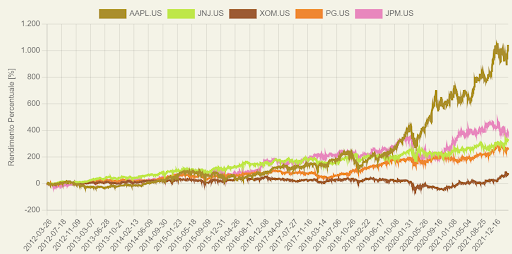
| Asset | Performance (10 years) |
|---|---|
| Apple | 1012.6% |
| JPMorgan Chase | 391.75% |
| Johnson & Johnson | 336.76% |
| Procter & Gamble | 250.45% |
| ExxonMobil | 62.23% |
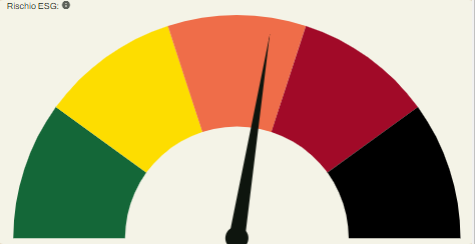
And from an ESG perspective, how is such a portfolio positioned?
The ESG tachometer positions the portfolio on an intermediate-high ESG risk level.
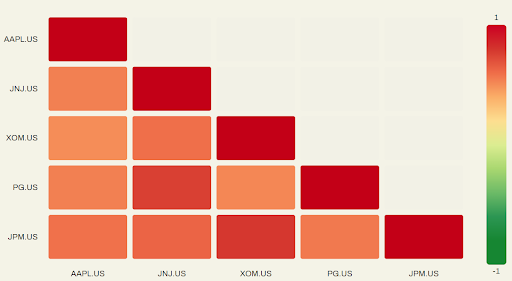
Securities correlation matrix –> Correlator.
The following correlation matrix shows that all stocks are positively correlated. The least correlated pair is Exxon/Apple which records a positive correlation of 0.31.
Conclusions.
The analysis was carried out on a portfolio in which the underlyings are equally weighted at 20 percent and are part of the same stock index: the S&P500. Despite the attractive returns achieved over the past 10 years, mainly driven by Apple stock, such a portfolio is poorly diversified and very volatile, having only a sector component as an element of diversification. The ESG profile of such a portfolio is at an intermediate-high level.
Related guides
Unraveling the Secrets: Key Indicators of an Overvalued Stock Market
Is the stock market overvalued or undervalued? It's a question that lingers in the minds of investors and financial …
Fundamental Analysis vs Technical Analysis: What are the Main Differences?
When it comes to investing, there are two main approaches to analyzing stocks and other financial assets: fundamental …
How interest rate developments influence the credit market
Interest rate developments are a key factor influencing all financial markets, including the credit and 'distressed …
