
Ulcer Performance Index: how to read the return-to-drawdown stress ratio
The Ulcer Performance Index (UPI) extends the Sharpe approach by focusing on downside phases only: how to calculate it, when to use it, and how to interpret it in Wallible.
Saturday, 8 November 2025

When evaluating a bond or multi-asset portfolio, average return alone is not enough. You also need to understand how painful the declines are during stress phases. The Ulcer Performance Index (UPI) was designed for this purpose: it relates excess return over the risk-free rate to average drawdown depth (Ulcer Index). It is especially useful when monitoring the “Risk-adjusted” section in Wallible.
Quick recap: what is the Ulcer Index
The Ulcer Index measures the average severity of periods where the portfolio is below its previous peak. For each observation $i$, use the percentage drawdown $D_i \le 0$ and compute the root-mean-square value:
$UI = \sqrt{\frac{1}{N} \sum_{i=1}^{N} D_i^2}$
Lower and shorter drawdowns lead to a lower index. It is a one-sided metric, so upside volatility is ignored.
Ulcer Performance Index formula
UPI combines risk premium with average downside depth:
$UPI = \frac{R_p - R_f}{UI}$
Where:
- $R_p$ is the portfolio return (cumulative or annualized) over the analyzed period;
- $R_f$ is the risk-free return aligned to the same time window;
- $UI$ is the metric above.
A high UPI means each percentage point of drawdown stress is compensated by substantial excess return. Values near 0 indicate that drawdown stress is not being rewarded.
Numerical example
For a simulated monthly portfolio (2024), consider this profile:
| Month | NAV | Drawdown | $D_i^2$ |
|---|---|---|---|
| Jan | 100 | 0.0% | 0.0000 |
| Mar | 99 | -2.9% | 0.0008 |
| Apr | 95 | -7.2% | 0.0052 |
| Aug | 99 | -1.9% | 0.0004 |
| Nov | 104 | -0.9% | 0.0001 |
The remaining months recover quickly to new highs. This leads to:
- Ulcer Index = 3.13%
- Cumulative return $R_p = +8.0%$
- Equivalent annual risk-free return $R_f = 2.0%$
- UPI = 1.92
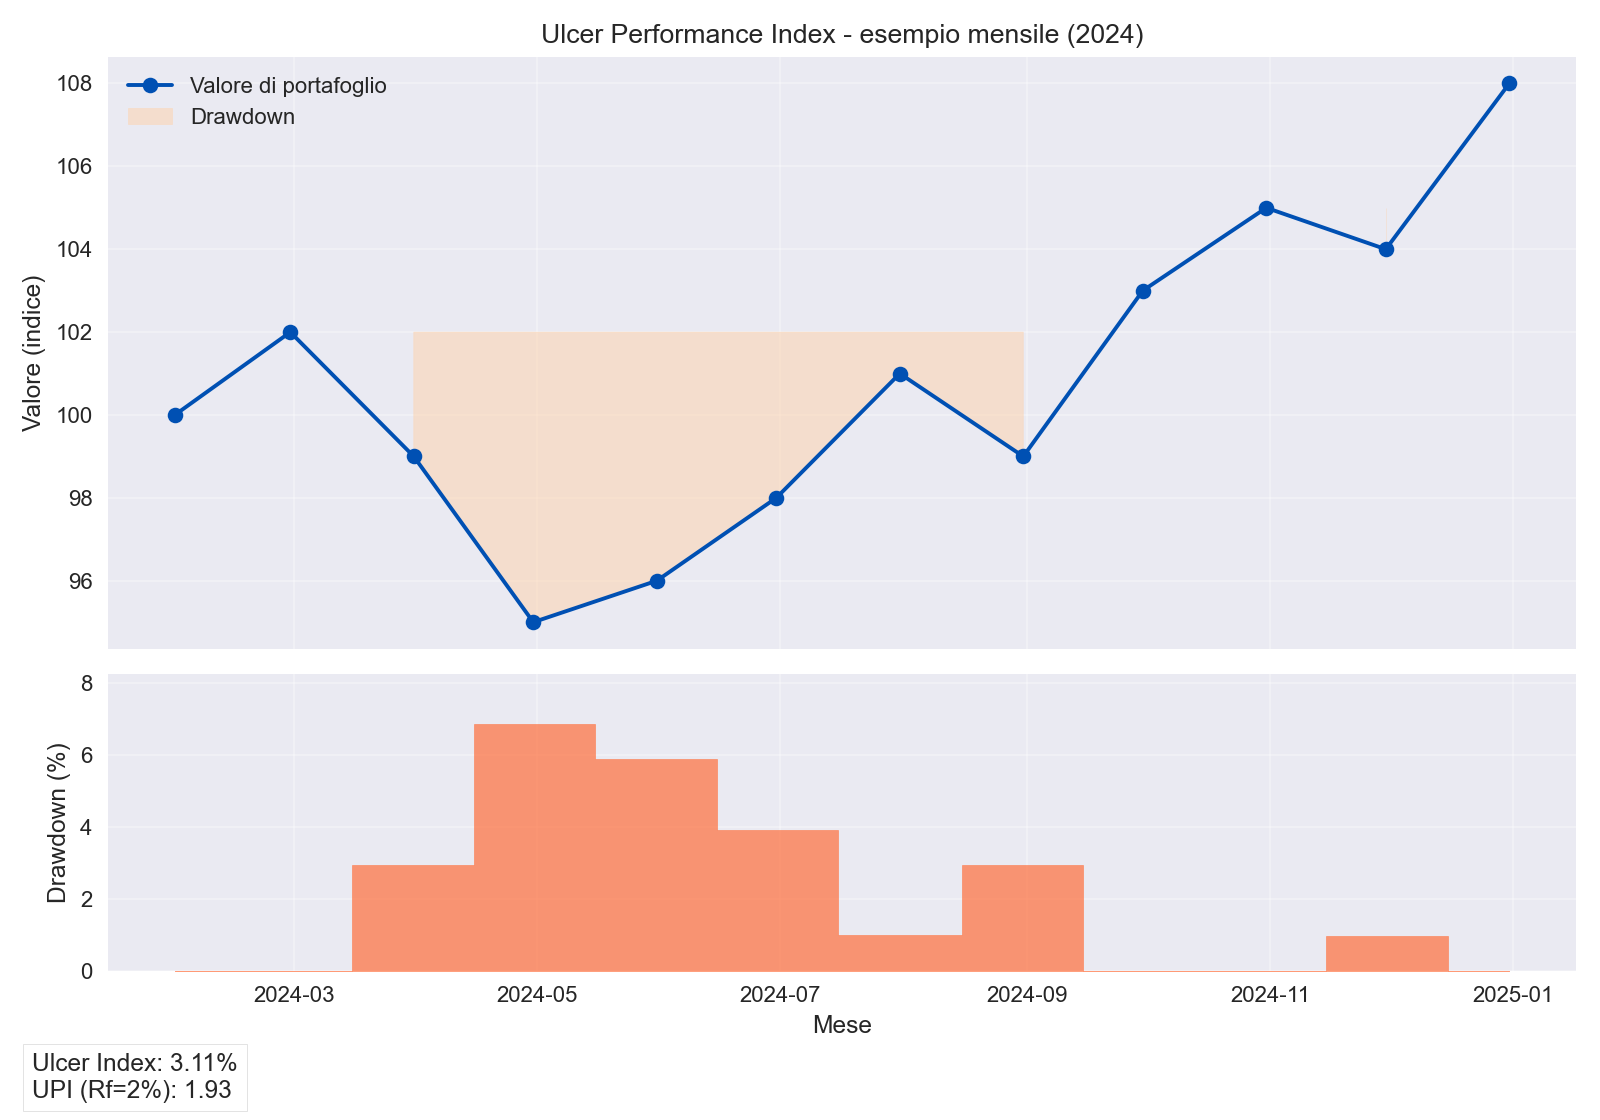
The chart highlights a contained drawdown area: recovery happens within a few months, and UPI stays above 1, often seen as a comfort zone for moderate-risk investors.
Practical interpretation
- UPI > 1.5: strong excess return per unit of average drawdown stress; common in disciplined portfolios or fast risk-control strategies.
- 0.5 < UPI <= 1.5: acceptable balance for core portfolios with equity or dynamic bond exposure.
- UPI < 0.5: excess return does not compensate downside stress; review risk management or costs.
Always compare portfolios with the same sampling frequency and the same $R_f$, otherwise comparisons become inconsistent.
Related guides
Skewness and Kurtosis: practical guide for portfolio risk
Understand skewness and kurtosis, how to read return-distribution shape, and why tails matter for risk decisions.
Expected Shortfall (CVaR) 95% and 99%: practical guide
Understand CVaR 95% and 99%, how it differs from VaR, and how to use tail-risk metrics for portfolio decisions.
Value at Risk (VaR) 95% and 99%: practical guide
Understand VaR 95% and 99%, historical vs parametric methods, and how to use VaR in portfolio decisions without common …
