
Gold in a Portfolio: How Much to Allocate and What the Metrics Actually Say
Gold and gold ETCs in a portfolio: how much to allocate based on correlation and Sharpe Ratio, Italian taxation, and physical gold versus miners.
Wednesday, 14 October 2026

Gold at record highs, and a badly framed question
Through 2026 gold has repeatedly hit new all-time highs, and financial headlines mention it every week. A colleague mentions buying a gold ETC six months ago and already sitting on a double-digit gain. The natural temptation is to ask whether now is the right time to buy gold.
That is the wrong question. An investor with a long horizon does not decide what belongs in a portfolio by looking at today’s price, but by looking at how an asset behaves alongside everything else already held. The right question is not “will gold keep rising,” which nobody can know, but “does gold improve my portfolio’s risk-adjusted return, and if so, how much of it makes sense.” Historical correlation and a few metrics answer that second question far better than any headline.
Why there is no such thing as a “gold ETF” in Europe
Anyone searching for a “gold ETF” on a European broker actually finds instruments called ETCs, not ETFs, and the difference is not just terminology.
UCITS rules, the same regulatory framework European ETFs operate under, impose diversification requirements that a single physical commodity cannot meet: a UCITS fund cannot put nearly all of its assets into one physical asset that generates no cash flow. That is why physical gold exposure in Europe is delivered through an ETC (Exchange Traded Commodity), a secured debt instrument backed by physical gold reserves held with a custodian, rather than a fund holding units of a diversified basket.
In practice the difference barely shows: a gold ETC from an issuer like iShares, Invesco, or Xtrackers trades on an exchange exactly like an ETF, with a real-time price, an ISIN, and an annual cost (TER) typically between 0.12% and 0.40% depending on the provider. Legally, though, an ETC is technically a secured debt instrument rather than a fund, which carries issuer counterparty-risk implications worth understanding, even though the largest physical gold ETCs on the market are fully backed by allocated physical gold verified through independent audits.
The math that matters: not return, correlation
The reason gold shows up in so many institutional portfolios is not that it “returns a lot.” Over multi-decade horizons, gold has historically returned less than global equities. The reason is different: its correlation with equities has historically sat close to zero over long periods, and tends to turn negative exactly during equity downturns, when diversification matters most.
The standard deviation of a two-asset portfolio depends not just on the volatility of each component, but on how the two move together:
$$\sigma_p = \sqrt{w_1^2 \sigma_1^2 + w_2^2 \sigma_2^2 + 2 w_1 w_2 \rho_{1,2} \sigma_1 \sigma_2}$$
where $w_1$ and $w_2$ are the weights of the two assets, $\sigma_1$ and $\sigma_2$ their respective volatilities, and $\rho_{1,2}$ the correlation between them. When $\rho_{1,2}$ is low or negative, that third term reduces total portfolio volatility by more than a simple weighted average of the individual volatilities would suggest. It is the same principle behind every diversified portfolio, applied here to an asset that moves on different drivers than stocks and bonds: central-bank demand, safe-haven perception during geopolitical stress, and mining supply that stays relatively rigid in the short run.
This explains why a 5% or 10% gold allocation can lower a stock-bond portfolio’s overall volatility even though gold itself, taken in isolation, is more volatile than bonds and pays no coupon or dividend at all.
How much this actually changes things: an illustrative example
To see the effect in numbers, take a classic 60% global equity, 40% bond portfolio and gradually swap in a gold allocation, keeping the stock-to-bond ratio on the remaining capital unchanged.
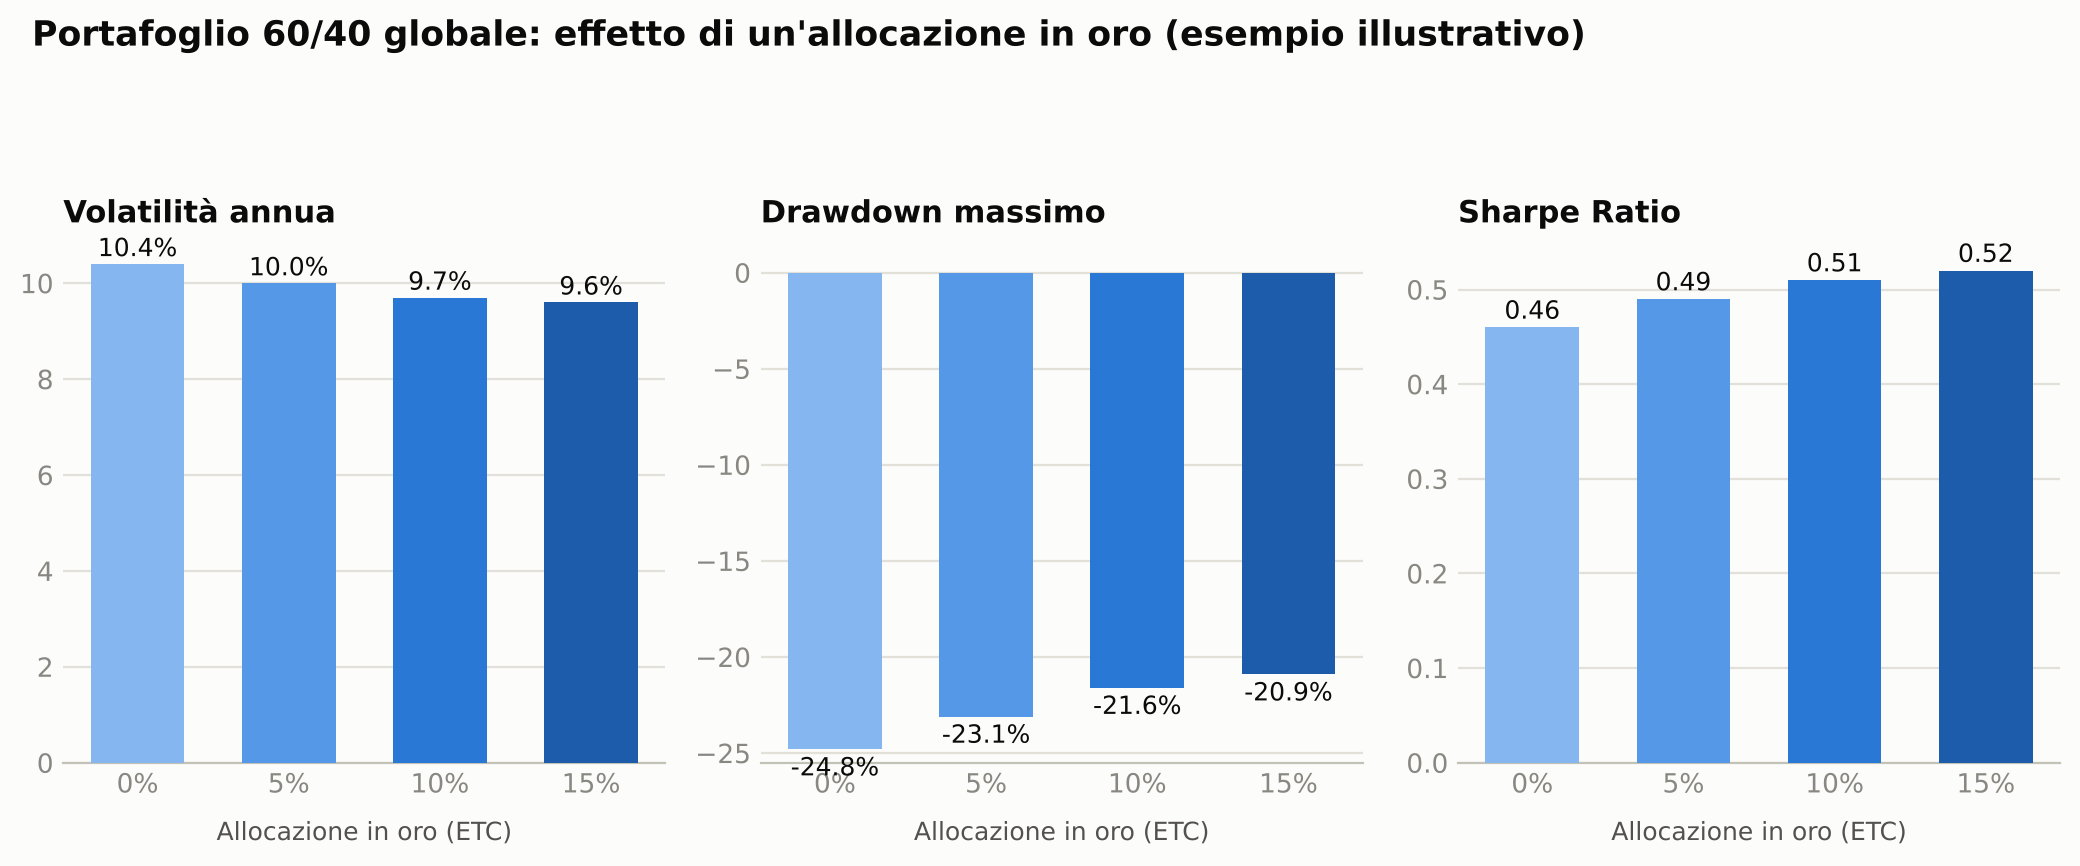
The figures are an illustrative example built on long-run assumptions for the return, volatility, and correlation of global equities, aggregate bonds, and gold, not a point backtest over a single historical period. Still, three things stand out clearly, and they are consistent with what has been observed across multiple real market cycles.
Overall volatility falls steadily as gold is added, even though gold on its own is more volatile than aggregate bonds. Maximum drawdown shrinks more sharply than average volatility, because gold’s diversifying effect tends to be strongest exactly during acute equity stress, when the correlation between stocks and gold often drops further still. The Sharpe Ratio improves up to a point, after which the marginal gains shrink: beyond roughly 10 to 15%, the added diversification benefit tends to be less than proportional, because the portfolio starts depending more and more on a single, non-productive asset.
None of these figures should be read as a forecast. They represent the order of magnitude of the effect that gold’s low correlation produces on a diversified portfolio, not a guaranteed return.
Physical gold, ETCs, and mining stocks: three different risks
Not every instrument marketed as “gold exposure” behaves the same way, and treating them as interchangeable is a common mistake.
| Instrument | What you actually own | Extra risk beyond the gold price | Liquidity |
|---|---|---|---|
| Physical gold (bars, coins) | The metal itself | None, but storage and insurance costs, wide bid-ask spread | Low, no instant resale |
| Physical gold ETC | A secured debt instrument backed by allocated physical gold | Issuer counterparty risk, generally marginal for large issuers | High, trades on an exchange like a stock |
| Gold mining equity ETF | Shares of listed mining companies | Operating, management, and financial-leverage risk of the miners, on top of the gold price | High, but materially more volatile |
A gold mining equity ETF is not a substitute for a physical gold ETC: it has historically amplified gold-price moves in both directions, because it layers equity and operating risk on top of the commodity. Investors seeking pure diversification, with the lowest possible correlation to the rest of an equity portfolio, find the physical gold ETC the more consistent fit for that goal. Those looking for a more speculative, higher-beta play on the gold price can consider mining equities instead, knowing they do not diversify in the same way.
Gold taxation in Italy: a detail that changes the comparison
Unlike Italian government bonds, capital gains realized on a gold ETC are taxed in Italy at 26% as redditi diversi (miscellaneous income), the same rate applied to stocks and most equity ETFs. They do not benefit from the preferential 12.5% rate reserved for government bonds and equivalent instruments, and they are not PIR-eligible.
This does not make gold less useful as a diversifier, but it matters when comparing it with other defensive portfolio components: a short-dated Italian government bond taxed at 12.5% and a gold ETC taxed at 26% serve different purposes. The former offers predictable income and capital certainty at maturity; the latter offers diversification away from equity risk, with no coupon and no guaranteed repayment date at all.
How much gold to allocate: reference frameworks
There is no single “correct” percentage, but a few well-known portfolios offer a useful reference point.
Ray Dalio’s All Weather portfolio typically allocates around 7.5% to gold, inside a structure designed to perform relatively steadily across different macroeconomic regimes (growth, recession, inflation, deflation). Harry Browne’s Permanent Portfolio, more extreme in its protective logic, goes as high as 25% in gold, paired in equal parts with stocks, long-term bonds, and cash.
For an investor building a diversified ETF portfolio without following one of these specific models, a range between 5% and 10% is a reasonable and widely used starting point in practice: enough to produce a measurable diversifying effect on volatility and drawdown, without making the portfolio overly dependent on a single asset that generates no earnings, pays no dividends, and whose price mostly reflects supply and demand dynamics rather than corporate cash flows.
The final choice depends on the investor’s macro view, the rest of the portfolio’s composition, and how much weight they want to give to protection against acute crisis scenarios relative to long-term growth.
How Wallible helps you check gold’s impact on your portfolio
Adding a gold ETC to an existing portfolio changes several metrics at once: volatility, maximum drawdown, Sharpe Ratio, and correlation with the rest of the holdings. With Wallible you can load your portfolio’s composition, simulate adding a gold position at different weights, and see directly how risk and return metrics change, rather than relying on a generic estimate like the one in this article.
Next step
Gold is not a bet on tomorrow’s price. It is a diversification tool whose usefulness is measured by its correlation with the rest of the portfolio, not by last year’s performance.
With Wallible you can:
- Analyze your portfolio and test how a gold ETC changes volatility, drawdown, and Sharpe Ratio against your current allocation
- Dig deeper into diversified portfolio construction with the guide to the lazy portfolio
- Compare the defensive bond sleeve with the guide to savings accounts, BTPs, and bond ETFs
Related guides
Home Bias: Why Italian Investors Overweight Italy in Their Portfolios
Home bias in Italy: why so many portfolios are overexposed to Piazza Affari, what it costs in lost diversification, and …
BTP Bond Ladder: How to Build a Maturity Ladder for Steady Fixed Income
How to build a BTP bond ladder for predictable fixed income in Italy: 12.5% tax rate, zero credit risk, and a …
Asset Allocation by Age: What Portfolio to Build at 30, 40, and 50
What stock-bond split makes sense at 30, 40, or 50? Human capital, glide paths, and practical rules for adjusting …