
Track Your Portfolio for Free: All Your Holdings and Allocation in One Place
A portfolio without monitoring is just a list of purchases. See your real value, every holding, and how your money is allocated, for free with Wallible.
Monday, 1 June 2026

Do you actually know what you own?
You bought an MSCI World ETF two years ago, added a bond ETF six months later, and reinvested a couple of dividends along the way. Now you open your broker app and see a total value: higher than what you put in, more or less. But what exactly do you hold today? How is that money split across asset classes, regions, and sectors? Is one position quietly dominating everything else?
Without a consolidated view, these questions stay unanswered, and the answer stays hidden across broker statements that never add up in one place.
This article shows what you can track for free with Wallible: your real consolidated value, every holding, and how your capital is actually allocated.
Why account value tells you almost nothing
The current portfolio value is the least informative number you can look at. It tells you nothing about what you actually own, how concentrated you are in a single region or sector, or whether two of your funds are really the same bet under different names.
A portfolio can be 15% higher than it was two years ago and still be dangerously concentrated, with most of that gain coming from one sector that is now due for a correction. The total value alone never reveals this. What reveals it is seeing every holding in one place and understanding how your money is split.
Everything you own, in one consolidated view
Most investors hold positions across more than one account: a main broker, an old account, maybe a pension wrapper. Each shows its own partial picture. Wallible brings them together into a single consolidated view: current value, each instrument, the quantity you hold, and the weight of every position in the whole portfolio.
Getting there takes no technical background and no paid subscription. Upload a CSV from your broker, import a PDF statement, or enter trades manually. Wallible recognizes thousands of financial instruments automatically, from UCITS ETFs to individual stocks to bonds.
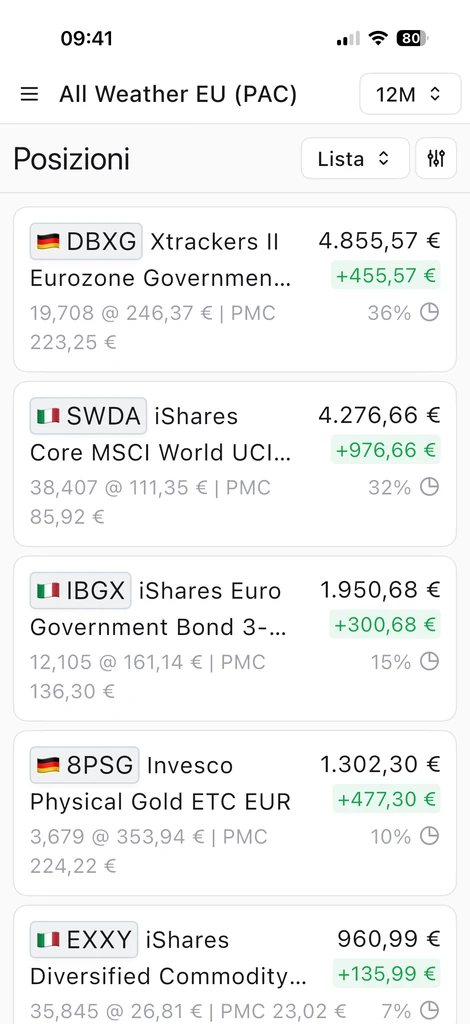 Wallible consolidates every position into one view, with current value, quantity, and portfolio weight.
See how your money is really allocated
One of the most common mistakes among retail investors is confusing the number of positions with the quality of diversification. A portfolio with five equity ETFs across different technology sectors is far less spread out than one with three funds across genuinely different asset classes.
You cannot see this from a list of tickers. You see it from the breakdown. Wallible shows your composition by asset class, geography, and sector in real time, so a portfolio with 80% in US equities shows up as exactly that: a concentrated bet, regardless of how many ETFs it uses.
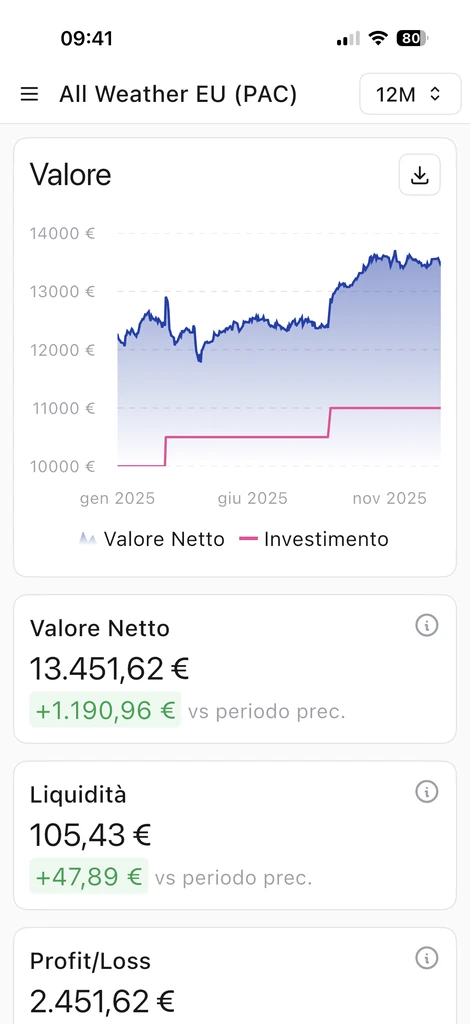 Wallible’s summary view shows current value and the breakdown of the portfolio by asset class, geography, and sector.
This allocation view is free, and it is one of the most useful things you can look at to understand the concentration you are actually carrying.
Getting started with Wallible: three steps
Import your transactions. Upload a CSV from your broker, import a PDF statement, or enter trades manually.
See your consolidated value and holdings. Every position lands in one view, with current value and weight, updated automatically with market data.
Review your allocation. Check how your capital is split across asset classes, regions, and sectors, and whether any single position has grown out of proportion.
A simple monthly routine
Portfolio monitoring does not require daily attention. In fact, checking your portfolio every day is one of the behaviors most likely to lead to poor decisions, driven by short-term noise rather than long-term signal.
An effective routine is a monthly look at your consolidated value and holdings, and a quarterly check of your actual allocation against the targets you set, rebalancing when a weight has drifted more than 5 to 10% from where you wanted it.
Going further
Once your portfolio is tracked, deeper analytics build on the same data. Time-weighted and money-weighted returns, risk metrics such as volatility, maximum drawdown, and the Sharpe Ratio, the correlation matrix, and the efficient frontier are available on Wallible’s paid Investor and Expert plans. They are the natural next step once you can already see what you own, but you do not need them to start.
Next step
An unmonitored portfolio is an unmanaged portfolio. Seeing what you own and how it is allocated is the foundation everything else builds on.
With Wallible you can:
- Create your portfolio for free and see your consolidated holdings and allocation immediately, no credit card needed
- Read the guide to realized performance monitoring to learn how returns are measured
- Explore the portfolio rebalancing guide to know when and how to update your allocation
Related guides
Robo-advisors in Italy: Are They Worth It Compared to a DIY ETF Portfolio?
Robo-advisor or DIY ETFs in Italy? Real costs, compounding math, 40,000-euro comparison over 20 years. When a …
Behavioral Finance: The Cognitive Biases Destroying Your Investment Returns
Loss aversion, recency bias, overconfidence: the cognitive biases that cost investors 2-3% per year. How to recognize …
Unit-Linked Life Insurance vs ETFs: What They Really Cost and When Insurance Makes Sense
Unit-linked life insurance vs ETFs: the Bank of Italy measured the cost gap. Real benefits, the term life + ETF …
