Comparison
Benchmarks and portfolio comparisons.
Comparison of investment strategies and portfolios
Comparing different investment strategies and portfolios is essential for both informed retail investors and professionals. A proper comparison helps you evaluate strengths, weaknesses, and consistency with your objectives. On this page we examine two classic methods (PIC and PAC), the role of benchmarking, the impact of rebalancing, and the key metrics for interpreting results over time.
Single investment (PIC) vs accumulation plan (PAC)
The PIC (Capital Investment Plan) invests all available capital at once. The PAC (Capital Accumulation Plan) spreads the investment over periodic contributions. The key difference is cash-flow timing: PIC gives immediate market exposure, while PAC builds exposure gradually. To simulate both strategies and compare outcomes, see Portfolio Simulator .
PIC: advantages and limitations
Advantages
- Capture market growth immediately on all capital.
- Simple implementation: one transaction.
- No commitment of future payments.
Limitations
- Greater risk of market timing: an unfavorable entry impacts the entire capital.
- Requires immediate availability of significant sums.
- Stronger psychological impact in case of initial decline.
PAC: advantages and limits
Advantages
- Reduces timing risk through time diversification.
- Applies the dollar cost averaging principle.
- Promotes discipline and continuity with regular contributions.
Limitations
- In strongly bullish markets it may be less profitable than the PIC.
- Part of the capital remains uninvested for a longer period.
- Possible recurring costs if the intermediary applies commissions per instalment.
Practical example (summary)
In phases of high volatility, a PAC tends to limit initial losses compared to a PIC, while in phases of constant rise the PIC tends to obtain greater overall returns. The choice depends on time horizon, availability of capital and risk appetite.
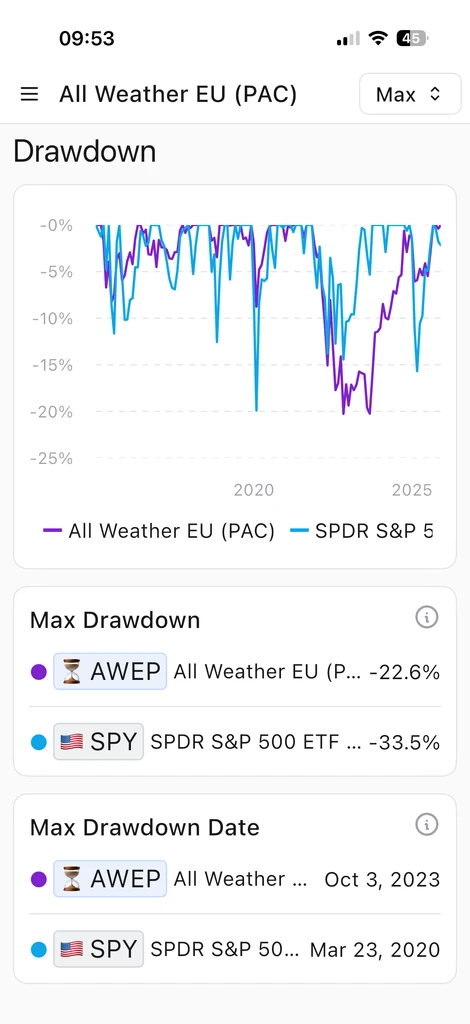
The importance of benchmarking
A benchmark is a reference (often a market index) used to evaluate whether a strategy is creating value relative to the market and the risk taken. A comparison without benchmarks can be misleading: +8% may look good, but if the market returned +12%, the strategy underperformed.
When comparing with the benchmark, it is useful to consider:
- Relative return and not just absolute.
- Risk taken to obtain the result.
- Consistency with strategic asset allocation.
To read these aspects with the correct metrics, see the Wallible Metrics Guide .
Effect of periodic rebalancing
Rebalancing brings asset-class weights back to target levels, preventing excessive drift in the risk profile. In general:
- Without rebalancing the portfolio can become more volatile and concentrated.
- With periodic rebalancing, the risk remains closer to the initial profile.
The impact on average returns in the long term tends to be limited, while the benefit on risk (volatility and drawdown) is often significant. Learn more in Rebalancing .
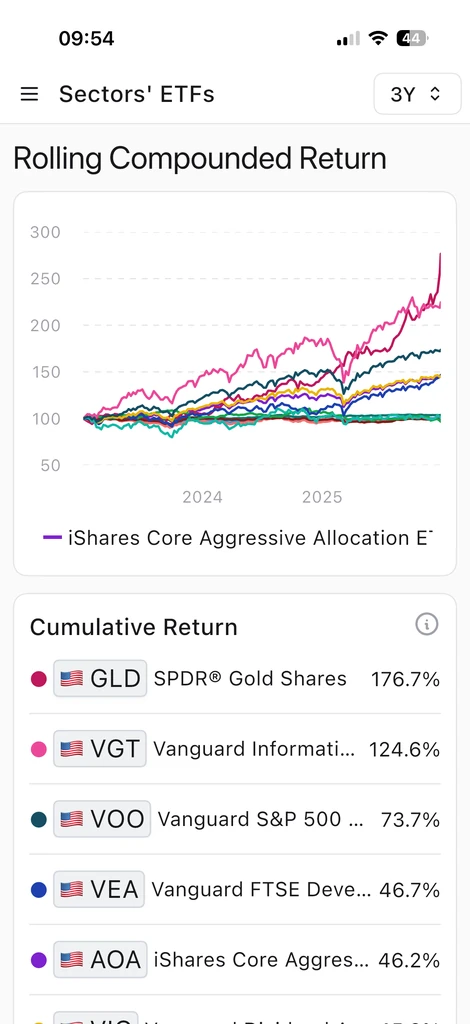
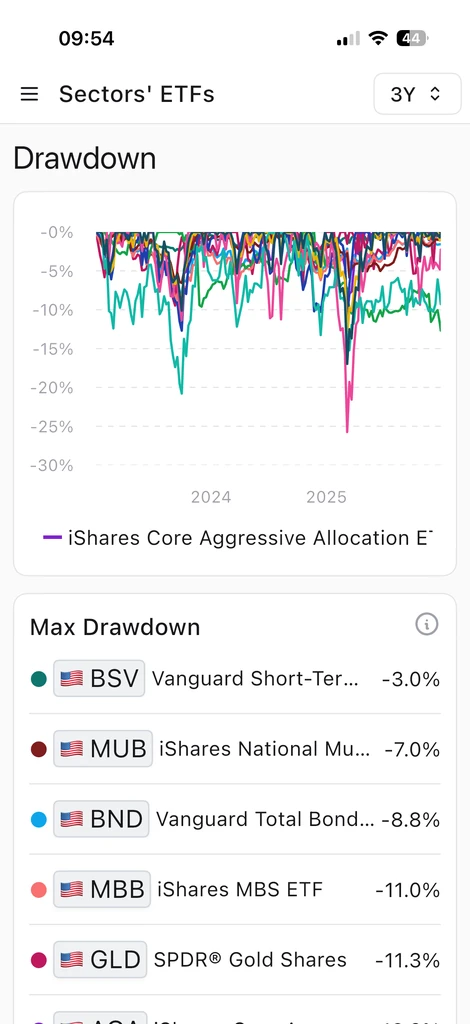
Comparative analysis over time and performance metrics
To evaluate strategies in the long term, consistent and comparable metrics are needed. Some of the most useful:
- Cumulative return and CAGR: overall and average annual growth (see Realized returns ).
- Volatility and drawdown: measures of risk and maximum loss (see Risk ).
- Sharpe and Sortino: risk-adjusted return.
- Tracking error: distance from the benchmark over time.
A well-done comparative analysis reduces emotions and helps you choose the strategy that is most consistent with your objectives.
Conclusions
Comparing PIC and PAC, measuring strategies against a benchmark, and evaluating the effect of rebalancing leads to better decisions. Simulations plus the right metrics help you understand not only how much a portfolio returns, but also how those returns are generated and with what level of risk.
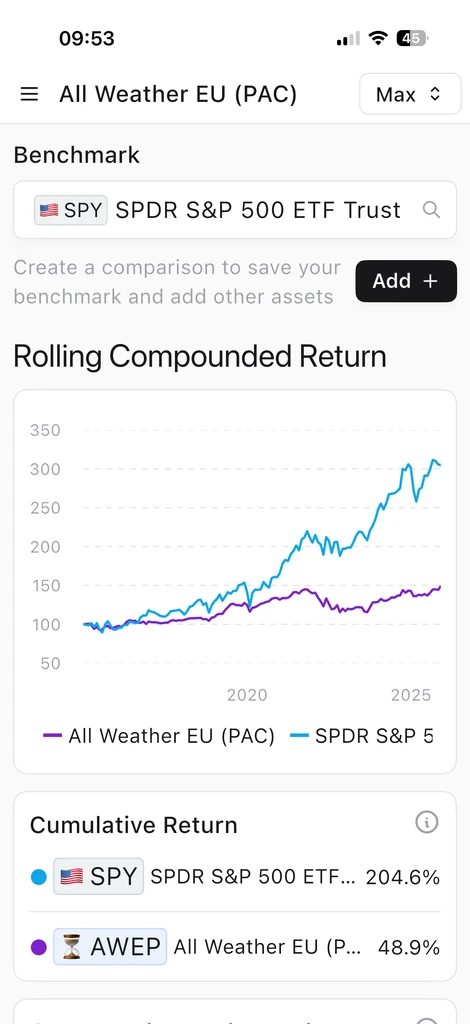
Comparison on Wallible
With Wallible’s Comparison feature you can compare investment strategies, portfolios and financial securities and view how returns have performed over time.
You can also compare the risks and the variability of the results, to understand which choice is more consistent with the desired profile.
Additionally, for each monitored portfolio or backtest simulation you can directly compare the results against a benchmark in the Comparison section of the portfolio/simulation page. Here you see both the trends over time and the main metrics compared.