
Current value
Value indicators, positions and cash flows.
Main metrics and views in portfolio management platforms
Managing an investment portfolio requires you to monitor key metrics to understand how your investments are performing. Modern portfolio management platforms offer intuitive views and indicators that help both retail and professional investors evaluate portfolio performance clearly and thoroughly. Below we present the main sections and concepts that these platforms make available, explaining their importance and use in simple and engaging terms.
Current value and NAV
One of the first pieces of information displayed is the Current Value of the portfolio, often also referred to as NAV (Net Asset Value) or net asset value. This represents the total market value of all positions in the portfolio at a given time. Comparing the current value with the invested capital (i.e. the total sum of money deposited or invested over time) is fundamental to understanding the overall performance. The difference between the current value and the invested capital indicates the total profit or loss accrued.
For example, let’s say you have invested a total of 100,000 EUR over time. If today the portfolio is worth 120,000 EUR, it means that you have an unrealized gain of 20,000 EUR (net of taxes and costs). Conversely, a portfolio that is worth less than the capital invested reflects a potential loss. Tracking these values over time is equally important: a time graph showing the trend of the NAV day by day (or month by month) allows you to see how your assets grow, highlighting the moments in which the portfolio gained or lost value.
This time view helps distinguish the market effect (value fluctuates based on stock prices) from the cash flow effect (how much capital has been added or removed). In practice, such a graph can show two curves: one of the portfolio value and one of the cumulative invested capital, highlighting the difference between the two.
Portfolio summary
The summary shows the main value indicators to quickly read the status of the portfolio.
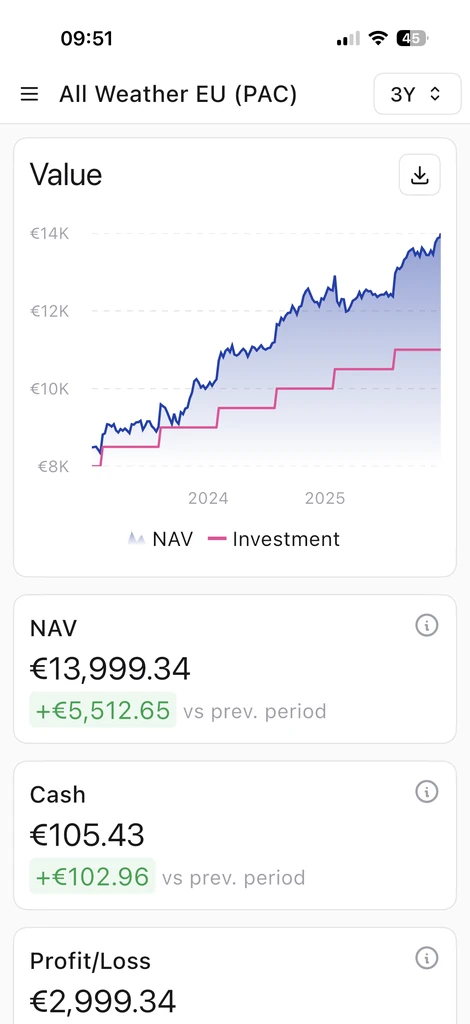
The screen summarizes NAV, invested capital, net value and available liquidity, offering an immediate reading of the portfolio status.
Value and invested
- NAV: overall value of the portfolio over time.
- Investments: capital actually paid.
- Net value: difference between current value and invested capital.
- Liquidity: Remaining cash available.
Here you see the recalculated profit/loss and the effect of investments, dividends and fees on the overall return.
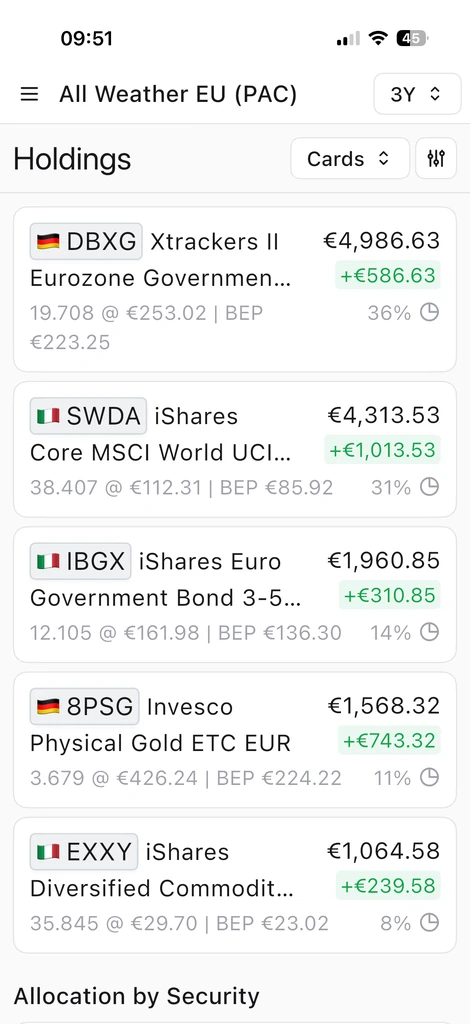
Positions
The Positions section lists all the financial instruments held in the portfolio, such as stocks, bonds, ETFs, funds, cash, etc. For each position, the platform usually displays key information such as the name of the instrument, the amount held, the current market value, the accrued profit/loss and the percentage weight on the total portfolio.
This view is equivalent to photographing the composition of the portfolio at a given moment. For example, in a 100,000 EUR portfolio, we might see positions like “Global The weight of each position indicates how much that single investment affects the total: it is useful for evaluating the risk concentration.
Tracking positions also helps you see the status of each investment: for example, you may be able to distinguish open (still held) positions from closed (sold) ones. In the context of a current portfolio, the position view focuses on open positions. Thanks to this section the investor can quickly answer questions such as “What do I have in my portfolio?” and “Which investments are performing better or worse?”.
Position details
The detailed view shows all the instruments in the portfolio, with quantity, current value and main changes. It is the starting point for understanding how the portfolio is made up.
Filters and sorts
Use filters and sorts to highlight the most relevant positions:
- Filter by open/closed positions.
- Sort by total value, return or percentage change.
- Change the profit/loss metric (absolute or relative).
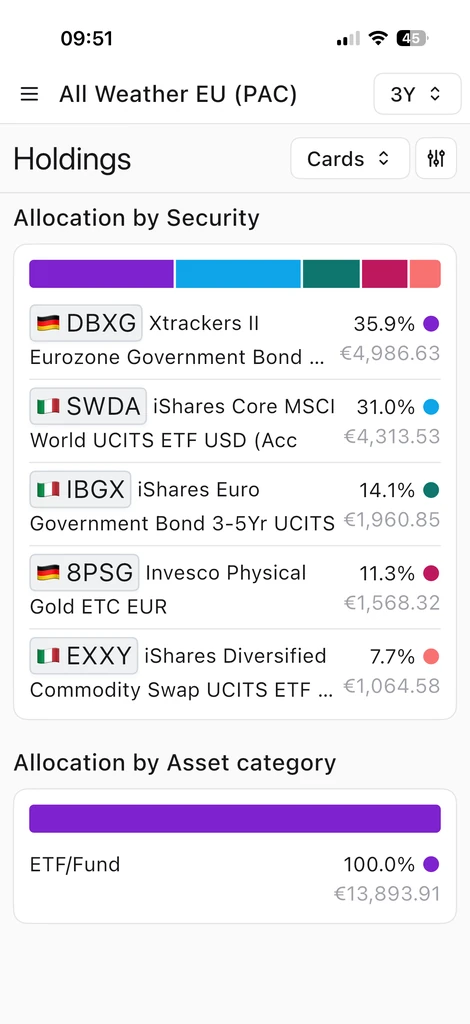
Allocations
A key principle of investing is diversification, and the Allocations view serves precisely to evaluate how diversified the portfolio is. This section groups positions by key categories, showing how much of the portfolio is allocated to each category. The most common allocations include:
- By instrument/title: how much each individual title weighs on the total.
- By asset class: the distribution between different asset classes (stocks, bonds, cash, etc.).
- By sector or industry: exposure to technology, healthcare, finance, etc.
- By geographic area: North America, Europe, emerging countries, etc.
- By currency: breakdown by currency of denomination of investments.
This allocation information is often represented with pie or bar graphs for easy understanding. The usefulness of this view is to highlight whether the portfolio is too concentrated on a certain investment or category, or whether it is well diversified. Allocations help you make rebalancing decisions and ensure your portfolio follows your desired strategy in terms of investment distribution.
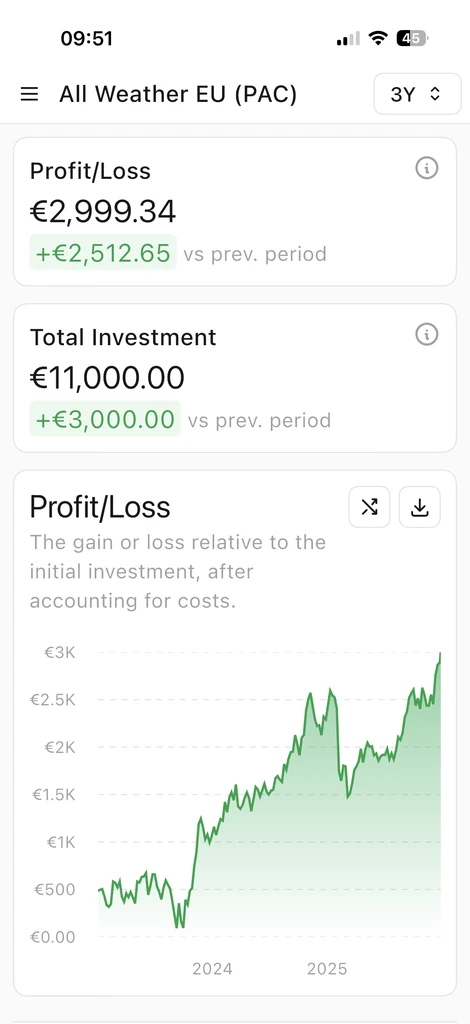
Profit and loss
The Profit and Loss (P&L) section provides portfolio performance metrics. This is where the investor sees how much he has gained or lost in absolute terms (euros) and percentages. There are several important views and metrics to consider:
- Total profit/loss: overall increase or decrease compared to the invested capital.
- Realized vs. unrealized gain/loss: distinction between closed positions and open positions.
- Time Performance: Performance over specific horizons (YTD, 1 year, 5 years, since inception).
- Percentage comparison: Comparison with benchmarks or other investments.
- Highlighted positions: stocks that drive or penalize performance.
An interesting part of this section is identifying the stocks that drive performance. Platforms often show which positions had the greatest positive or negative impact, helping to understand “what is working” and “what isn’t” in the portfolio.
Investments, dividends and commissions
In addition to market variations, the performance of a portfolio is influenced by incoming and outgoing flows and costs. Portfolio management platforms tend to summarize these elements to show their impact on the portfolio’s return and value. In particular, it is useful to consider:
- Investments (capital injections): Money added over time, which increases NAV but is not a performance gain.
- Dividends and Coupons: Periodic payments received from investments, which contribute to returns.
- Fees and costs: trading fees, management costs, performance or consultancy fees and taxes.
Seeing the impact of costs in a transparent way helps you understand how much you are really earning net of expenses and whether it is appropriate to look for more efficient solutions.
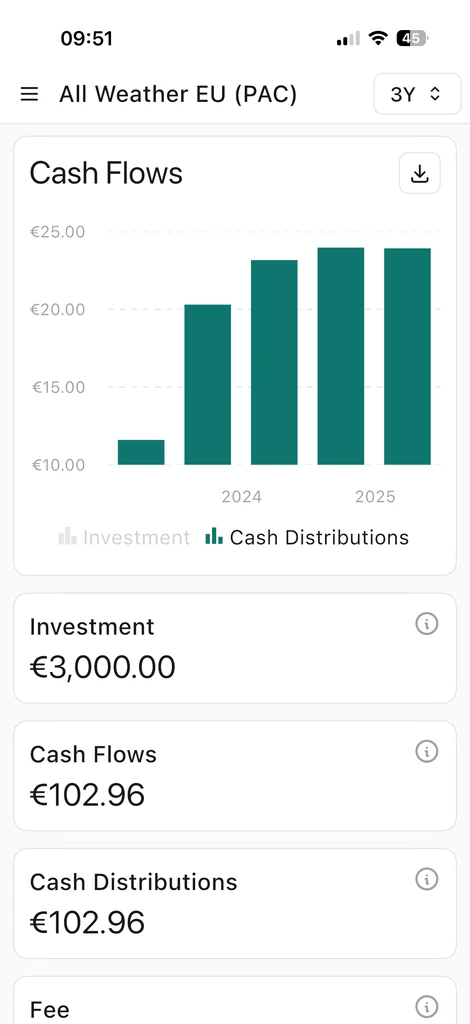
Cash flows
The Cash Flows section offers a detailed view of all monetary movements in and out of the portfolio. This is where investments (capital deposits), distributions (withdrawals) and various costs paid are tracked chronologically. In practice, it is like an investment portfolio statement.
Visualizing cash flows is crucial to understanding the net invested and the evolution of the portfolio net of movements. By combining this information with the NAV chart, it becomes clearer why the value of the portfolio has changed over certain periods.
A fundamental aspect is to understand how capital movements (deposits and withdrawals) influence the perception of performance. This reading helps link the portfolio’s performance to the capital movements made by the investor, providing a more realistic view of the return.
In practice, every significant change in the portfolio must be read for its cause: market or capital movement? For example, an increase in value may be due to a large payment and not to a real market return. Metrics such as money-weighted return help isolate the effect of market movements versus capital movements.
Cash distributions
This section shows dividends and cash distributions generated by the portfolio. It is used to understand how much of the return comes from periodic flows.
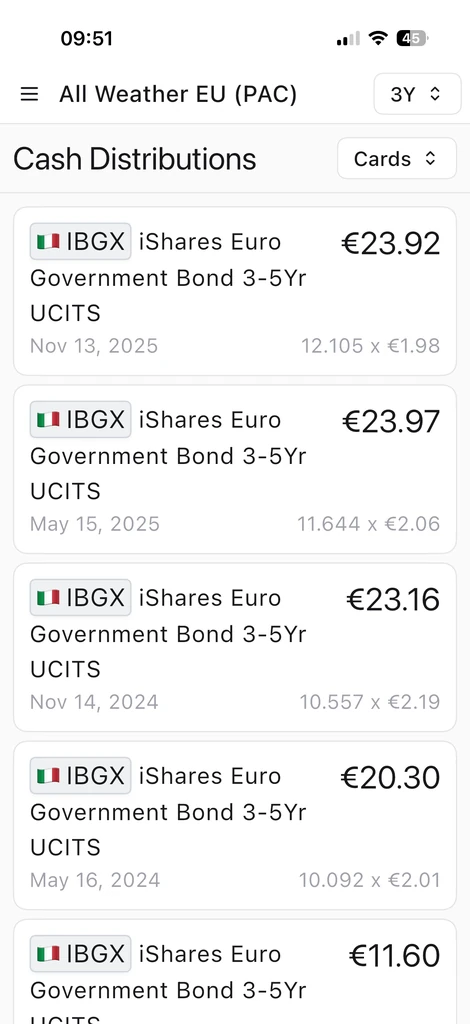
- Dividends collected over time.
- Cash distributions by instrument or period.
- Trend of flows in the long term.
Cash flow
The cash flow graph summarizes investments, distributions and fees over time. It is useful for understanding when the main capital movements occurred.
- Investments: Net deposits or withdrawals.
- Cash distributions: dividends or inflows.
- Fees: operating costs related to operations.
The summary below summarizes total flows, distributions and available liquidity.
Impact on NAV
Cash flows have a direct impact on the value of the portfolio. This section helps link dividends and distributions with NAV:
- NAV and flows: when flows increase or stabilize the value.
- Cumulative effect of distributions.
- Relationship with performance over time.
Dividends and periodic flows
Many investors are interested in understanding how much of the return comes from periodic income (dividends, coupons, interest) compared to the gain from the increase in value of the shares. Isolating the contribution of periodic flows is useful for distinguishing cash collected from latent capital gains and for planning the strategy: those looking for stable periodic income will prefer portfolios with a high contribution from dividends or interests, while those aiming for capital growth will look more at potential capital gains.
Conclusion
Portfolio management platforms provide a variety of metrics and views to help investors fully understand their portfolio. From a general overview of value and performance, to details on holdings and diversification, to analysis of cash flows and sources of return, each section offers a look from a different perspective.
Using this information in synergy, an investor can make more informed decisions, identify strengths and weaknesses of their strategy and have full awareness of how and why their assets are growing (or why they are decreasing). Knowing the “why” behind the numbers is the first step to improving your investment strategy and achieving your financial goals.
