
Ibbotson cone
The Ibbotson cone shows in a simple way how an investment can evolve over time, highlighting both the expected scenario and the possible best and worst outcomes. It helps to understand the link between risk and return and the impact of the time horizon on the probabilities of gain or loss.
Ibbotson cone
The Ibbotson cone is a financial analysis tool that allows you to intuitively represent the expected evolution of an investment, relating expected return, risk (volatility) and time horizon.
The graph takes the shape of a cone because, as time passes, uncertainty about future scenarios increases: the area of possible outcomes widens, immediately showing how the risk grows together with the investment horizon.
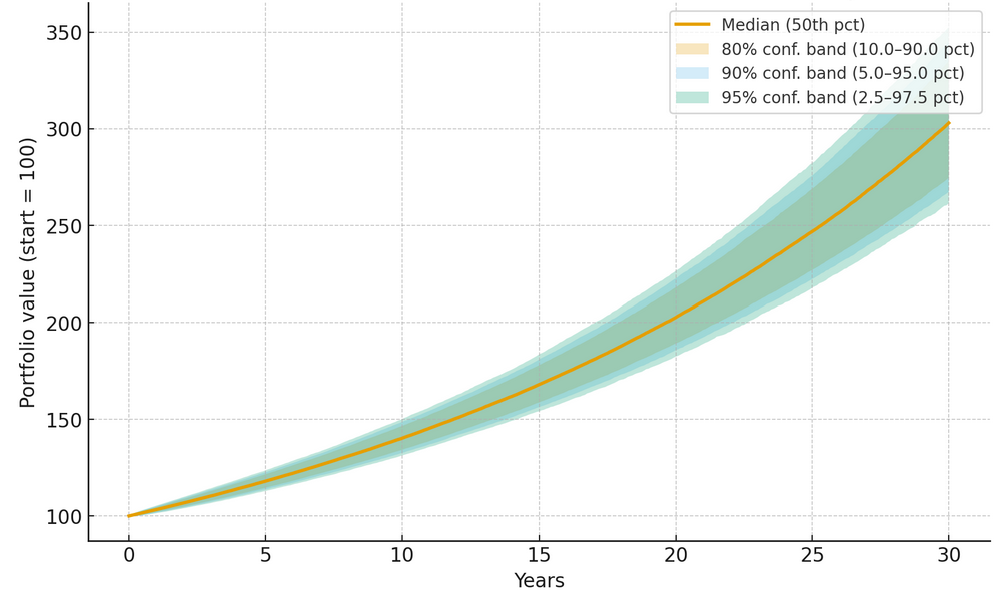
In general, the cone allows you to visualize three main trajectories:
Centerline (median scenario) It represents the estimated evolution of the portfolio based on expected returns.
Top line (optimistic scenario) Indicates the performance of the portfolio in cases where the markets perform better than expected. Statistically, only in a small percentage of cases (e.g. 5%) is it expected to obtain results above this line.
Bottom line (pessimistic scenario) It shows how the portfolio performs in worst-case situations, such as financial crises or market shocks. Here too, with reduced probability (e.g. 5%), the values can fall below this threshold.
Because it’s useful
- Understanding the risk/return trade-off: highlights that potentially higher returns always correspond to greater variability in results.
- Probabilistic approach: the cone is based on confidence intervals (e.g. 90% or 95%), thus providing a measure of the probability that the actual results fall between the represented limit values.
- Decision support: allows the investor to evaluate whether the level of risk associated with the investment is consistent with his tolerance and objectives.
- Impact of time: Helps understand how the time horizon affects the risk and magnitude of future scenarios.
In summary, the Ibbotson cone translates statistical and probabilistic concepts into a simple to interpret image, offering the investor a clear picture of the possible trajectories that their investment could follow.
