
Monte Carlo analysis
Discover how Wallible's Monte Carlo simulation projects thousands of possible scenarios for your portfolio and how to interpret the results easily, even without advanced financial knowledge.
What is Monte Carlo simulation
Monte Carlo analysis is a statistical tool that imagines thousands of possible futures for your portfolio. Starting from the historical returns of the securities you own and their volatility, the model generates 10,000 alternative scenarios to answer questions such as:
- How much could the portfolio be worth in 1, 5 or 10 years?
- What is the probability of exceeding (or failing to reach) a certain goal?
- How much do daily fluctuations really matter in the long run?
This analysis does not provide certainties, but a probabilistic map that helps you understand the range of plausible outcomes and their probability.
How scenarios are created
- Starting data - Current value of the portfolio, returns and historical volatility of each instrument, correlations between securities.
- Random Simulations - For each of the next 120 months (10 years) the model extracts plausible returns, respecting observed average, risk and correlations.
- Repetitions - The process is repeated 10,000 times, generating as many possible paths for the evolution of the portfolio.
- Statistics - From the simulated paths we obtain distributions, probabilities and summary indicators (percentiles, expected return, risk of loss, etc.).
With rebalancing or not
You can choose whether to assume that the portfolio is rebalanced periodically to the initial weights (T0) or to let it evolve freely. Rebalancing reduces the dispersion of outcomes because it brings the weights back to the original proportions; without rebalancing, the stocks with better (or worse) performance end up weighing more (or less) and the scenarios are more extreme.
Absolute or relative view
- Absolute: Results are expressed in the portfolio currency (e.g. EUR). This is useful when you have a specific monetary goal.
- Relative: shows percentage changes compared to the initial value. It is perfect for comparing strategies or understanding profit/loss in percentage terms.
How to read graphs
1. Scenario curve
The first view shows a selection of the 10,000 simulated routes. Each line represents how the value of the portfolio could evolve over time.
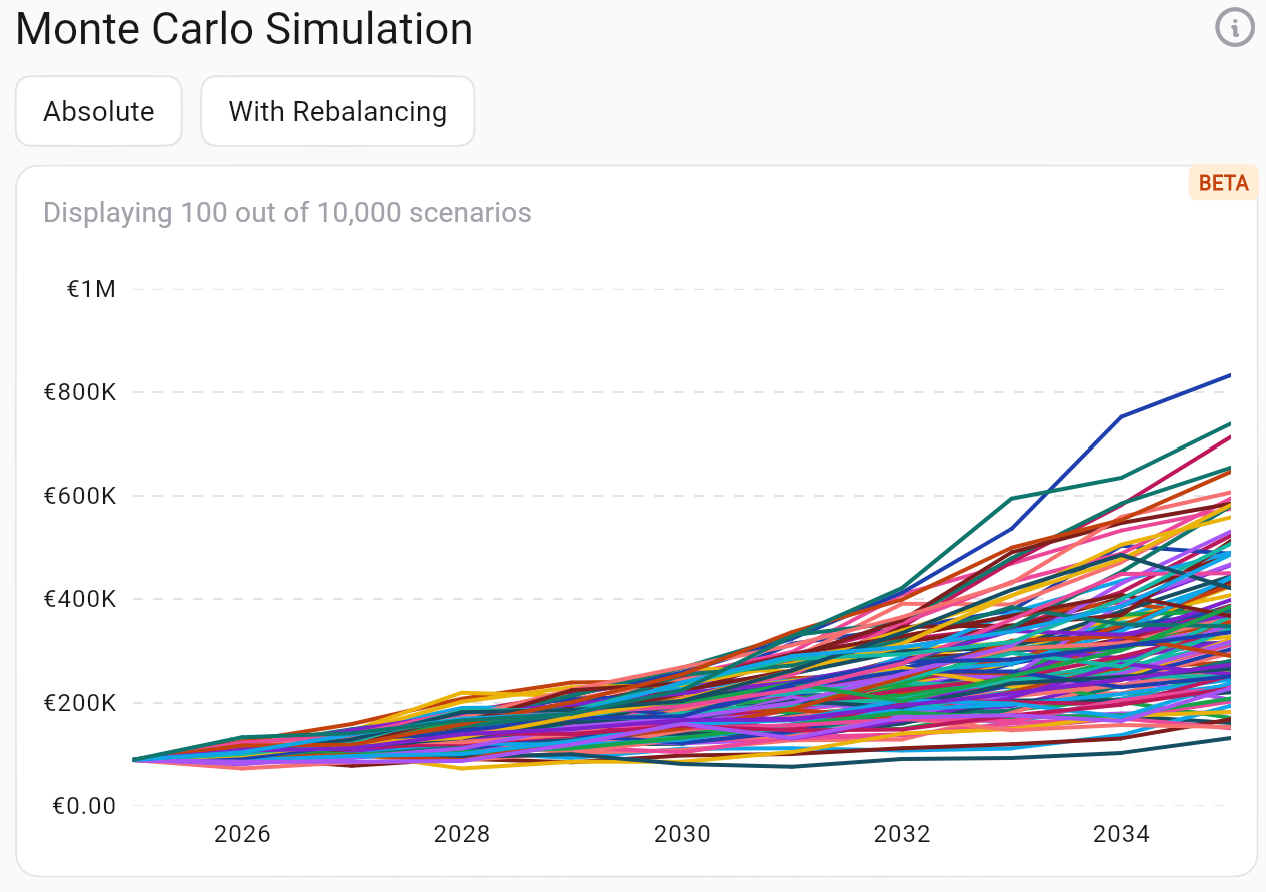
What to observe:
- The cloud of lines makes the idea of uncertainty immediate: the further we go in time, the more the scenarios move away from each other.
- The central fan indicates the most probable outcomes, while the more extreme lines represent very positive or very negative scenarios.
- In relative mode you can understand at a glance how much the portfolio could grow or shrink in percentage terms.
2. Histogram of 10-year results
The second graph summarizes all the scenarios looking only at the result after 10 years. Each bar shows the probability that the portfolio will end in a certain range of values.
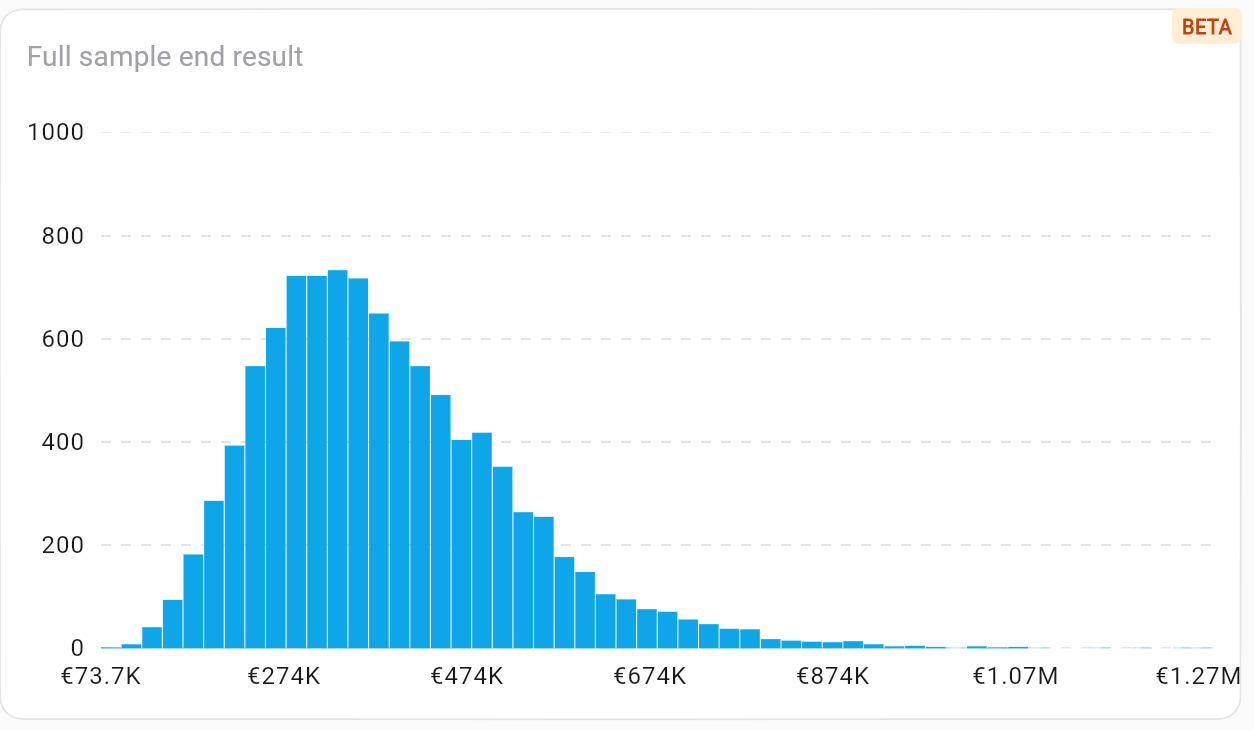
How to interpret it:
- The highest bar indicates the most frequent result among simulations.
- The right tail represents very favorable outcomes, while the left tail shows the worst case scenarios.
- By moving the slider (when available) you can read the probability of achieving a specific goal.
Practical tips
- Define the goal in advance: Knowing what value you want to achieve makes it easier to interpret the distribution.
- Compare multiple setups: Test the simulation with and without rebalancing to understand how much your risk changes.
- Check the percentiles: The values at the 5th, 50th and 95th percentiles tell you the very negative, median and very positive cases respectively.
- Use relative view for quick comparisons with other portfolios or strategies.
- Remember that this is a probabilistic estimate: actual events may still differ, especially in the presence of market shocks.
Because it is also useful for non-experts
- We translate complex concepts (volatility, distributions, correlations) into intuitive graphs.
- The labels in Italian and the explanations guide the reading step by step.
- You can freely explore scenarios without the need for formulas or calculations - the system does the heavy lifting and gives you readable probabilities.
With Monte Carlo simulation you thus obtain a realistic - although not certain - picture of how your portfolio may evolve, helping you to make more informed decisions about investments, objectives and the level of risk you are willing to tolerate.
