
Realized performance
Return, risk and historical correlations of the portfolio.
Portfolio performance analysis
Analyzing the performance of an investment portfolio means examining not only how much return has been obtained, but also what risk has been taken to obtain it and how the various components of the portfolio behave with each other through historical correlations. From a medium-long term perspective, typical of those aiming for consistent asset growth, it is essential to find a balance between these three aspects. An informed investor must ask himself: am I getting an adequate return for the risk I take? Is my portfolio sufficiently diversified thanks to favorable correlations between assets? An in-depth analysis of each of these elements follows, with the main evaluation metrics and practical examples to make the concepts concrete.
Realized returns
The return of a portfolio indicates the increase in value achieved over a given period. For investors focused on the medium to long term, it is important to look beyond short-term fluctuations and focus on compound capital growth over time. A key metric for evaluating the growth of an investment is the CAGR (Compound Annual Growth Rate). CAGR measures the average annual growth rate of an investment over a multi-year period, taking into account the compound capitalization of returns. In practice, the CAGR answers the question: at what constant annual rate did my portfolio grow over the period considered?
For example, if a portfolio was worth 100 and after 5 years it has risen to 150, the CAGR is approximately 8.4% per year. This means that, on average, the portfolio grew 8.4% each year, even though in reality the annual returns were uneven. The CAGR allows for a homogeneous comparison of different investment strategies over long time horizons, because it smooths out intermediate volatilities, showing the overall effect of growth over time.
A portfolio with a high CAGR indicates a strong increase in capital in the long term, an ideal condition for asset growth objectives. However, a high return alone is not enough: it must always be placed in relation to the risk incurred to obtain it.
A practical example: two portfolios may have the same CAGR of 6% per year over 10 years, but one may have gone through 10% drawdown while the other 35% drawdown. With the same average growth, the risk profile is very different and the psychological and financial sustainability of the strategy changes.
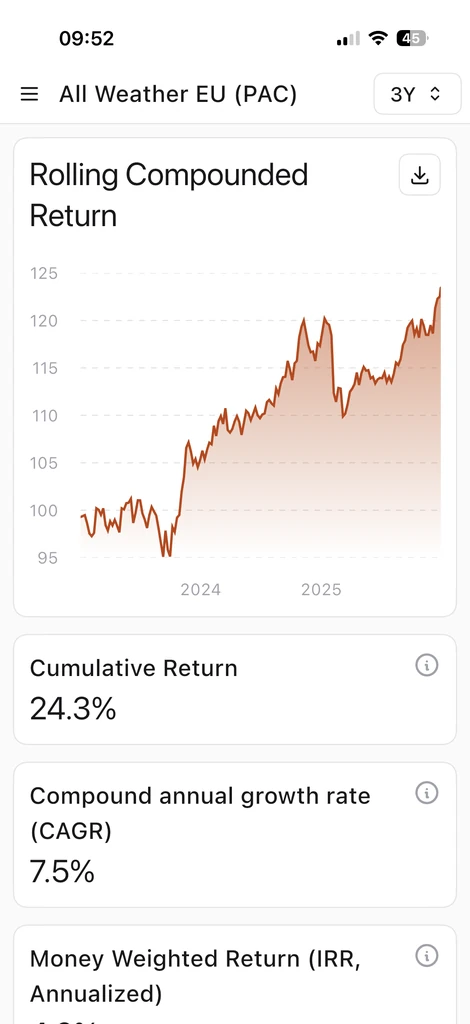
In Wallible you will find a complete view of the realized performance metrics:
- Cumulative return over time
- CAGR (compound annual growth rate)
- IRR (cash weighted return)
- Sharpe ratio and Sortino ratio
A useful example to distinguish cumulative return and IRR: if you invest EUR 10,000 immediately and add EUR 5,000 halfway, the cumulative return measures the overall growth of the portfolio, while the IRR considers the times and amounts of the flows. In the presence of significant deposits or withdrawals, the IRR offers a more realistic reading of the actual performance perceived by the investor.
Returns per period
You can analyze the seasonal trend with graphs dedicated to returns by period. This view is useful for spotting recurring patterns, comparing months or quarters, and seeing if the strategy is most effective at specific intervals of the year.
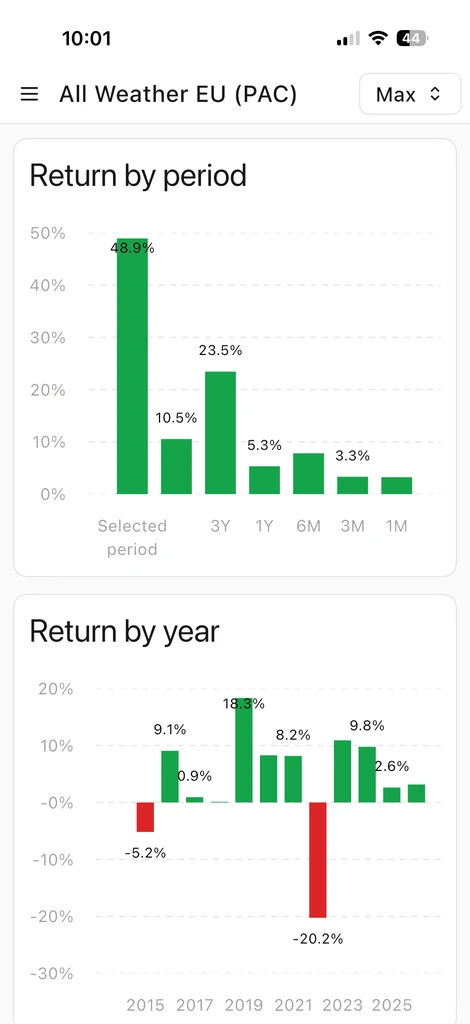
These graphs help to contextualize the performances: a negative return in a historically weak month can be read with greater awareness than the simple precise data.
Risk and drawdown
Risk is the other side of the coin compared to return. In finance, risk is often associated with volatility, or the magnitude of fluctuations in the value of an investment. High volatility means that the value of your portfolio can fluctuate dramatically in the short term - big ups but also potentially significant downs. Low volatility, on the other hand, indicates that the portfolio has more stable and predictable movements. However, it is important to distinguish between temporary volatility and the risk of permanent loss of capital.
Market volatility is often temporary: a portfolio can undergo even marked negative fluctuations and then recover over time. If the investor has a long horizon and is not forced to liquidate in negative phases, such fluctuations are mainly short-term noise. The real risk, however, is the possibility of a permanent loss, that is, seeing the capital irreversibly reduced without ever recovering.
In terms of risk-adjusted return, two strategies with similar performance can be very different: a portfolio with an average return of 7% and volatility of 15% is not equivalent to one with the same return but volatility of 8%. Metrics such as Sharpe and Sortino serve precisely to quantify how much quality there is behind the performance.
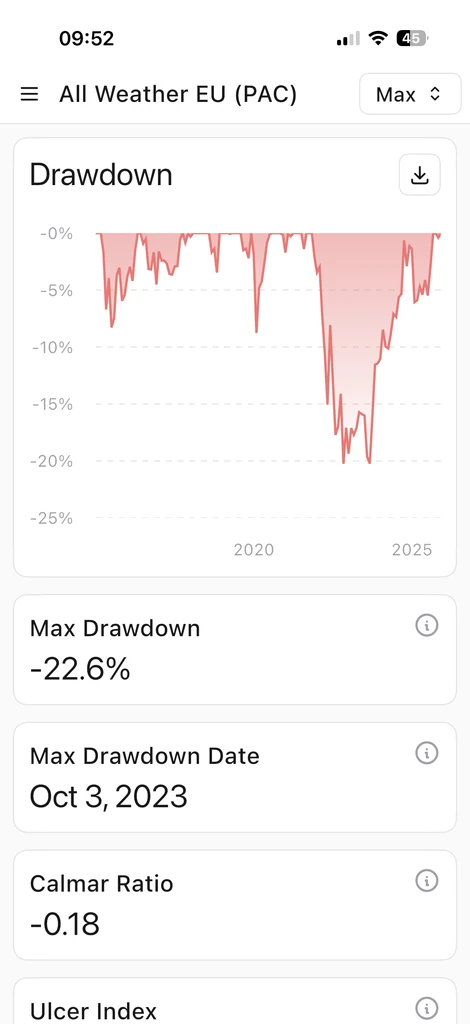
To evaluate the risk profile of a portfolio, several quantitative metrics are used. Here are the main metrics available in Wallible:
- Maximum drawdown: maximum loss from peak to trough.
- Calmar ratio: ratio between return and maximum drawdown.
- Ulcer index: intensity and duration of the loss phases.
- Recovery factor: recovery speed after the worst drawdown.
To learn more about the definitions you can consult the Guide to Wallible metrics .
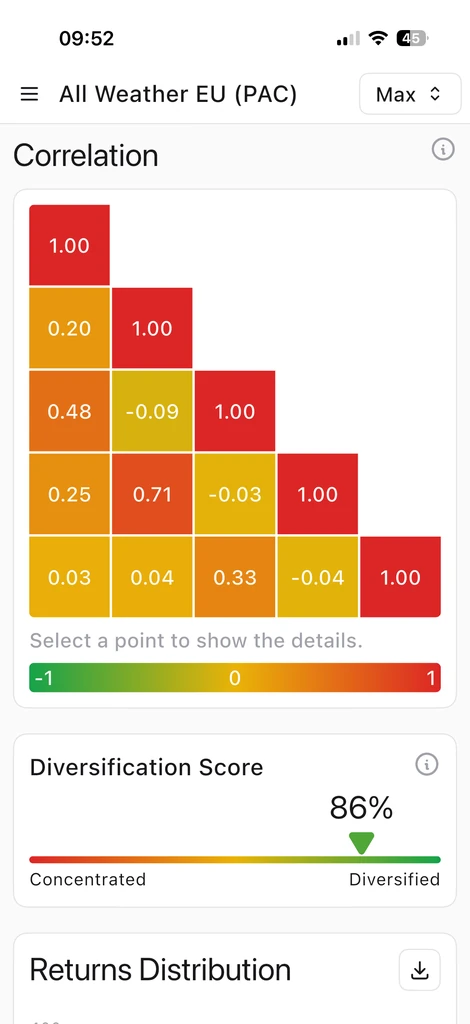
Historical correlations: the power of diversification
The third pillar of portfolio analysis is the study of the correlations between the various asset classes and financial instruments within it. Correlation measures how similar or opposite two assets tend to move. It is expressed with a coefficient that varies between -1 and +1:
- Correlation +1 (perfect positive): two assets always move in the same direction with proportionally equal intensity.
- Correlation -1 (perfect negative): when one asset rises the other falls in a mirror-like manner.
- Correlation 0 (null): the movements of the two assets are independent of each other.
In practice, correlations between assets are rarely exactly +1 or -1; they usually take intermediate values and can vary over time. Why are correlations so important for a medium to long-term investor? Because a low correlation (even better if negative) between the assets in the portfolio is the key to effective diversification. Combining financial assets with poorly correlated trends allows you to reduce the overall volatility of the portfolio and mitigate the risk of significant losses on all capital simultaneously.
It is useful to analyze historical correlations because they offer insights into how assets have interacted in various market scenarios. However, correlations are neither static nor guaranteed for the future: in times of panic or global shocks, normally decorrelated assets can end up all moving in the same direction, temporarily reducing the benefits of diversification. This is why it is important to periodically monitor and rebalance your portfolio: see Rebalancing .
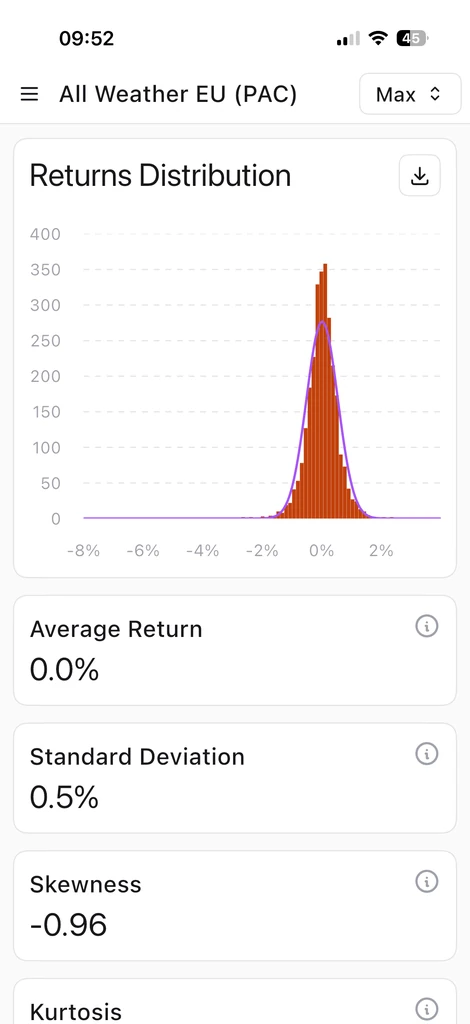
Distribution of returns
The distribution of returns helps to understand how the portfolio behaves over time. In addition to the mean, Wallible calculates indicators of skewness and kurtosis, which describe the shape of the distribution and the presence of extreme tails. Together with Value at Risk (VaR), this analysis allows you to evaluate the probability of significant losses and compare portfolios with different risk profiles.
Conclusions
Portfolio performance analysis requires a 360-degree look at return, risk and correlation. Metrics such as CAGR, drawdown, Sharpe and Sortino provide concrete tools to quantify the growth and stability of a portfolio, helping to make informed and informed decisions.
Ultimately, a professional approach combines quantitative analysis (performance metrics, distribution of returns, correlations) with strategic discipline. It means setting the portfolio on personal objectives, monitoring its progress with the right indicators and making adjustments when necessary, without being guided by emotions.
