Ibbotson Cone
The Ibbotson Cone clearly shows how an investment may evolve over time, highlighting both the expected scenario and the possible best and worst outcomes. It helps to understand the relationship between risk and return and the impact of the investment horizon on the probabilities of gain or loss.

Ibbotson Cone
The Ibbotson Cone is a financial analysis tool that makes it possible to intuitively represent the expected evolution of an investment, linking expected return, risk (volatility) and time horizon.
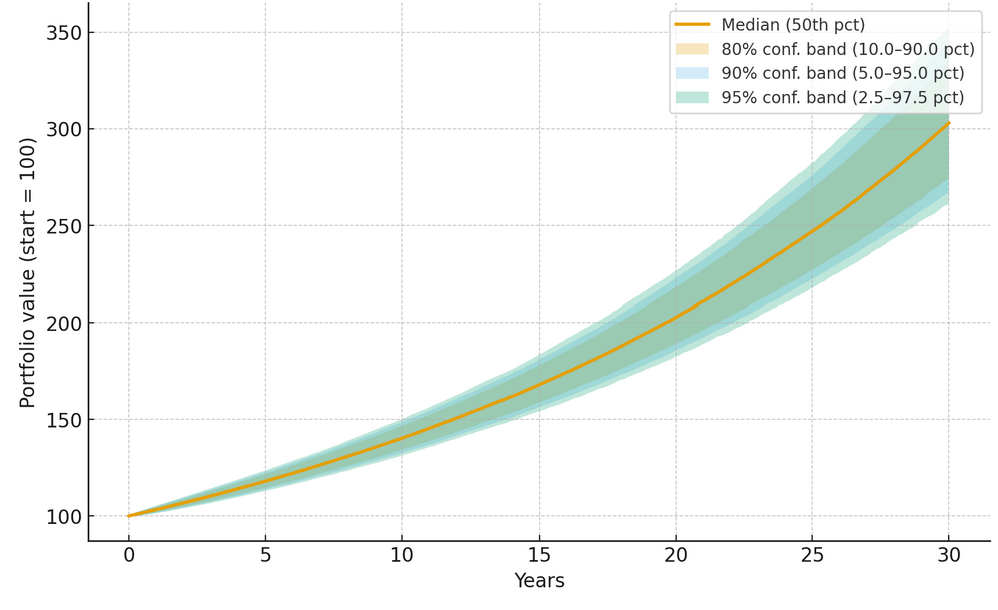
The chart takes the shape of a cone because, as time goes by, uncertainty about future scenarios increases: the area of possible outcomes widens, immediately showing how risk grows together with the investment horizon.
In general, the cone makes it possible to visualize three main trajectories:
Central line (median scenario)
Represents the estimated evolution of the portfolio based on expected returns.Upper line (optimistic scenario)
Indicates the portfolio’s performance in cases where markets perform better than expected. Statistically, only in a small percentage of cases (e.g. 5%) is it expected to achieve results above this line.Lower line (pessimistic scenario)
Shows the portfolio’s performance in the worst situations, such as financial crises or market shocks. Again, with a reduced probability (e.g. 5%), values may fall below this threshold.
Why it is useful
- Understanding the risk/return trade-off: highlights that potentially higher returns always come with greater variability of outcomes.
- Probabilistic approach: the cone is based on confidence intervals (e.g. 90% or 95%), thus providing a measure of the probability that actual results will fall within the represented limits.
- Decision support: allows the investor to assess whether the level of risk associated with the investment is consistent with their own tolerance and objectives.
- Impact of time: helps to understand how the investment horizon affects risk and the breadth of future scenarios.
In summary, the Ibbotson Cone translates statistical and probabilistic concepts into a simple, easy-to-interpret image, offering the investor a clear view of the possible trajectories their investment might follow.
Disclaimer
This article is not financial advice but an example based on studies, research and analysis conducted by our team.