
Monte Carlo Analysis
Learn how Wallible's Monte Carlo simulation projects thousands of potential futures for your portfolio and how to interpret the outcomes with confidence.
What Is Monte Carlo Simulation
Monte Carlo analysis is a statistical tool that imagines thousands of possible futures for your portfolio. Starting from historical returns, volatility, and correlations, the model generates 10,000 alternative scenarios to answer questions such as:
- How much could my portfolio be worth in 1, 5, or 10 years?
- What is the probability of reaching (or missing) a specific goal?
- How relevant are day-to-day swings compared with the long term?
The simulation does not guarantee an outcome. It delivers a probability map that helps you understand the range of plausible results and how likely they are.
How the Scenarios Are Built
- Starting data – Current portfolio value, historical returns and volatility for each holding, and their correlations.
- Random simulations – For every one of the next 120 months (10 years) the model draws plausible returns that respect averages, risk, and correlations.
- Repetition – The process repeats 10,000 times, creating just as many potential paths for your portfolio.
- Statistics – From the simulated paths we extract distributions, probabilities, and summary indicators (percentiles, expected return, probability of loss, and more).
With or Without Rebalancing
You can decide whether the simulation assumes a periodic rebalancing back to the initial weights (T0) or lets the weights drift naturally. Rebalancing narrows the spread of results because it restores the original mix; without it, winners grow heavier and losers lighter, so outcomes become more extreme.
Absolute or Relative View
- Absolute view: results are expressed in the portfolio currency (e.g., EUR). Choose it when you have a monetary target.
- Relative view: shows percentage changes versus today. Ideal when comparing strategies or understanding potential gains and losses in percentage terms.
How to Read the Charts
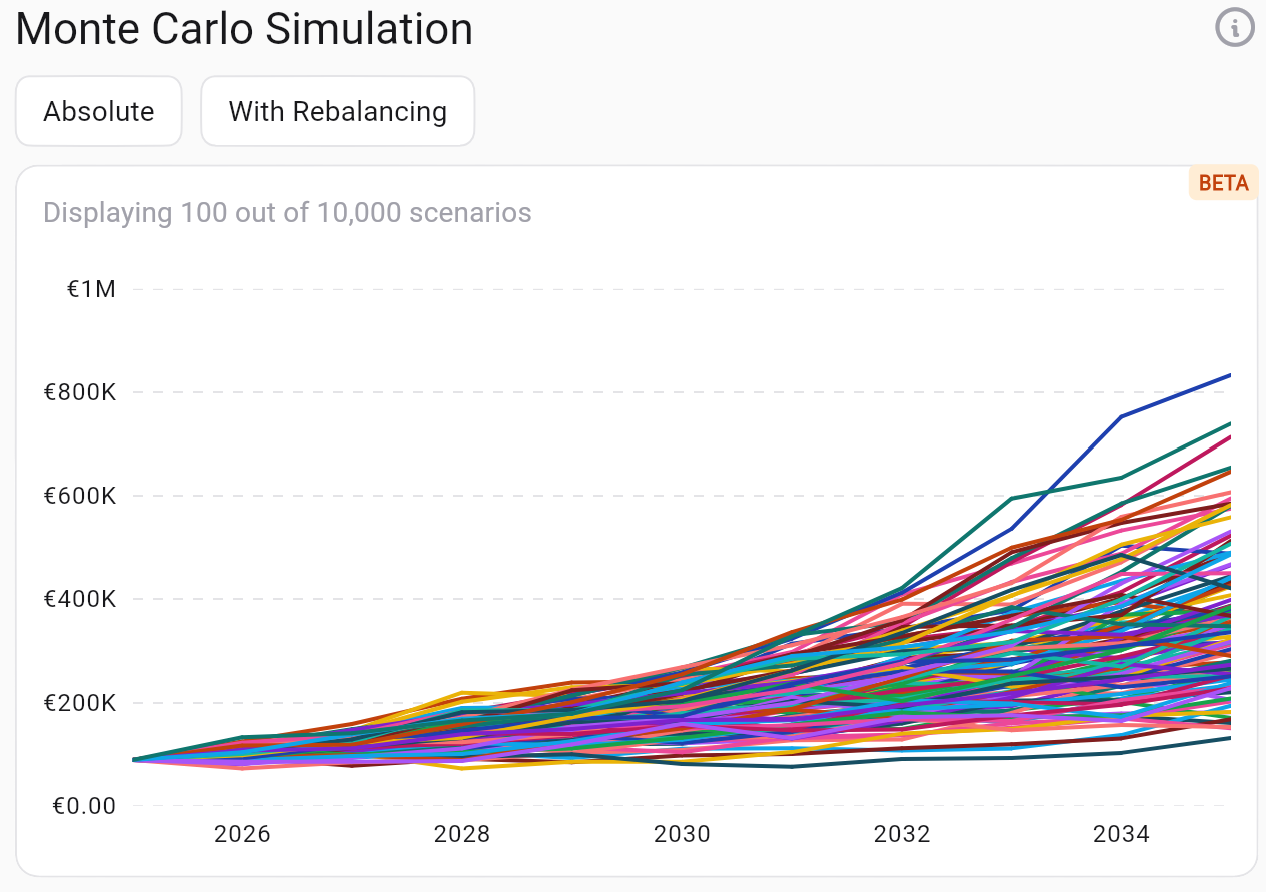
1. Scenario Curves
The first chart displays a selection of the 10,000 simulated paths. Each line shows how the portfolio value might evolve over time.
Look for:
- The cloud of lines, which illustrates uncertainty: the further in time, the wider the spread.
- The central fan, representing the most likely outcomes, while the outer lines are optimistic or pessimistic extremes.
- In the relative view you can instantly gauge potential percentage increases or drawdowns.
2. Ten-Year Outcome Histogram
The second chart summarises the scenarios by looking at the portfolio value exactly 10 years from now. Each bar shows the probability of ending up in a given range.
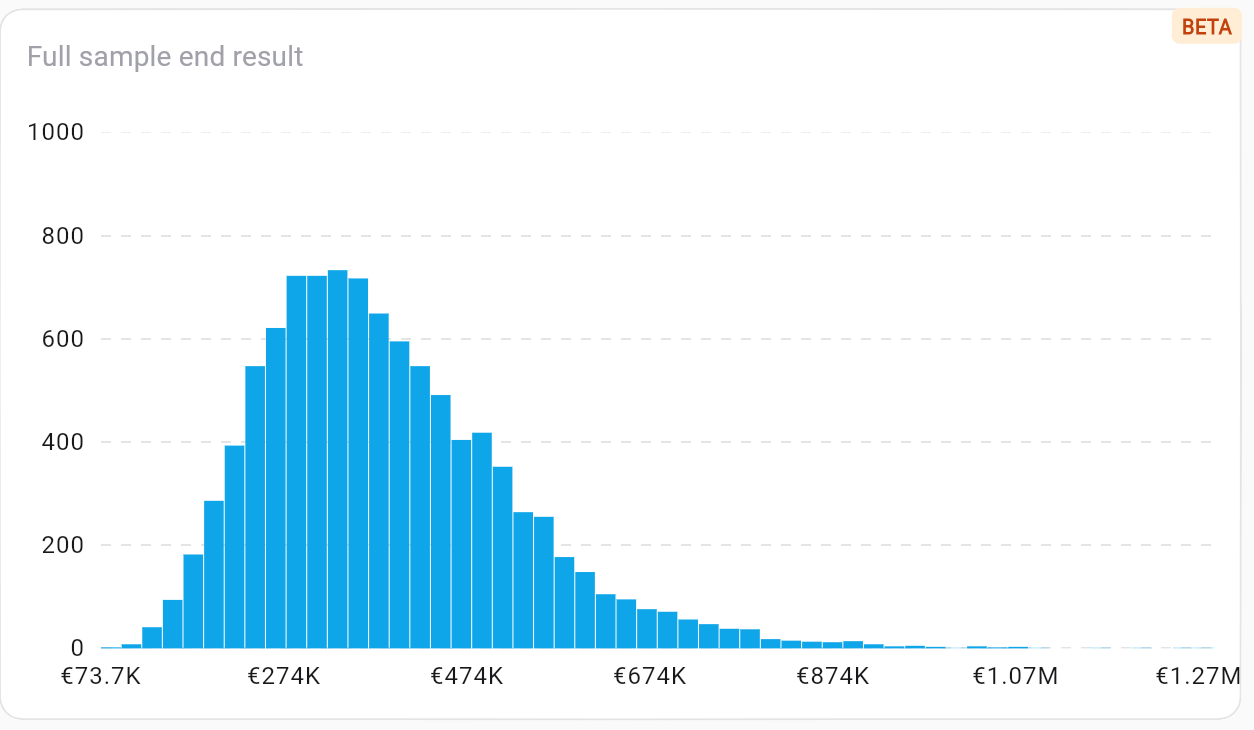
How to interpret it:
- The tallest bar marks the most frequent result across simulations.
- The right tail highlights very positive scenarios, while the left tail shows the worst cases.
- Moving the cursor (when available) reveals the probability of hitting a chosen target.
Practical Tips
- Define your goal upfront: knowing your target value makes the distribution easier to interpret.
- Compare multiple setups: toggle rebalancing on and off to see how much risk changes.
- Watch the percentiles: the 5th, 50th, and 95th percentiles describe bad, median, and great scenarios.
- Use the relative view for quick comparisons with other portfolios or strategies.
- Remember this is a probabilistic estimate: real markets can deviate, especially during shocks.
Why It Helps Non-Experts Too
- Complex notions (volatility, distributions, correlations) are turned into intuitive visuals.
- Plain-language labels and guided explanations walk you through each step.
- You can explore scenarios with no formulas: the system does the heavy lifting and serves readable probabilities.
Discover how easy it is to replicate this analysis and many other investment strategies in the Wallible app. With free registration you get access to all the tools.
Sign up for freeWith Monte Carlo simulation you obtain a realistic—though never certain—picture of how your portfolio could evolve, helping you take more informed decisions about investments, goals, and the level of risk you are willing to tolerate.
Disclaimer
This article is not financial advice but an example based on studies, research and analysis conducted by our team.